.svg)

Aug-2026
Sales
Trend
6-Month
Product Count
SKUs
Avg Price
YoY Sales Change
YoY Price Change


Market Insights Snapshot
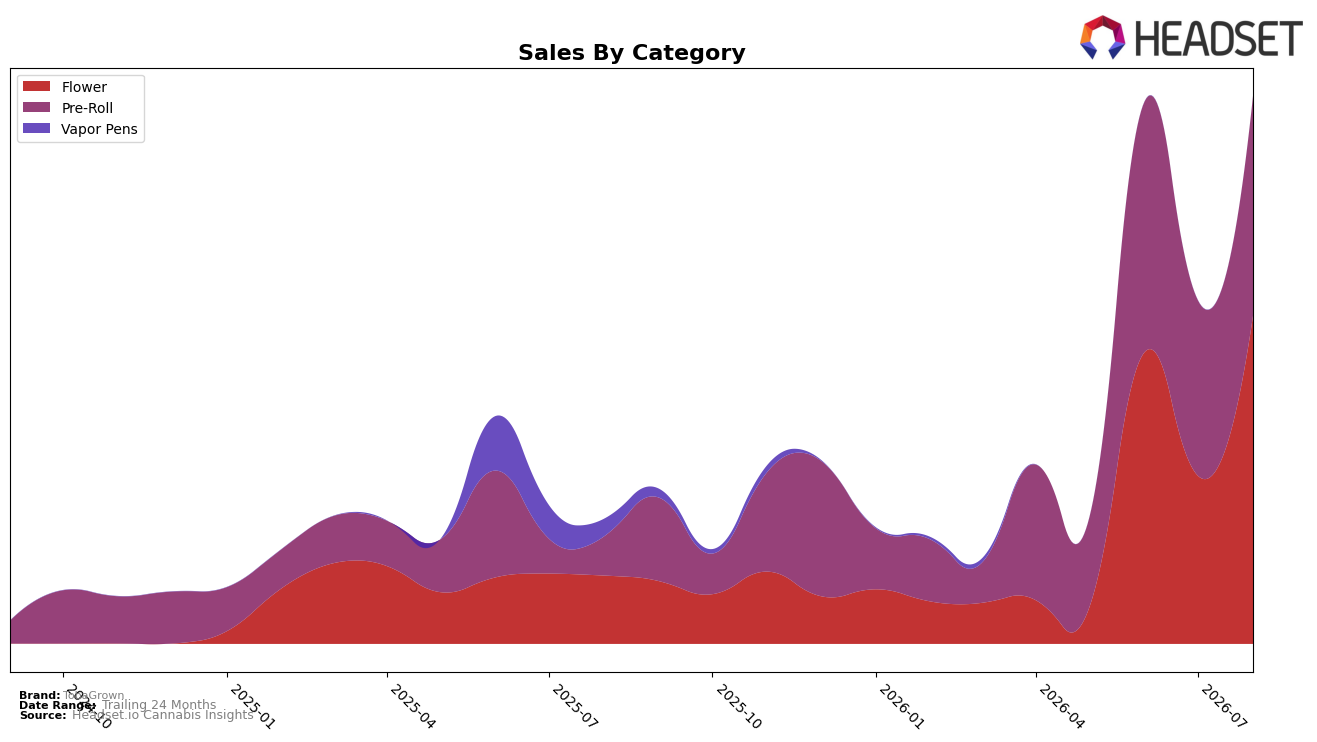
TobaGrown’s August 2026 mix concentrated in Flower at 59.93% share while Pre-Roll held 40.07%, with Flower up 382.39% YoY and 95.64% MoM, and Pre-Roll up 465.88% YoY and 25.32% MoM. Average price climbed 56.46% YoY to $30.88, with category-level pricing dispersion as Flower averaged 36.93 and Pre-Roll 24.80, indicating a trade-up alongside volume expansion. In Saskatchewan Flower, the brand sat at rank 24, pairing a mid-pack position with a 340.99% YoY sales lift overall; the pattern implies that the current surge is driven by expanded Flower distribution and upsized ticket rather than purely discount-led gains.
The sharper 95.64% MoM acceleration in Flower versus 25.32% in Pre-Roll, combined with Flower’s 59.93% share, implies a pivot toward core potency and larger pack sizes that can elevate visibility in rank ladders like Saskatchewan Flower rank 24 and create headroom for mix-led margin. Pre-Roll’s 465.88% YoY growth but slower MoM trajectory relative to Flower suggests that incremental growth will increasingly rely on Flower assortment depth and price architecture rather than additional Pre-Roll line extensions. Net effect: the mix tilt and price step-up point to a positioning anchored in premium-leaning Flower that can translate into share gains if sustained, while Pre-Roll plays a supporting role to defend basket frequency.
Competitive Landscape
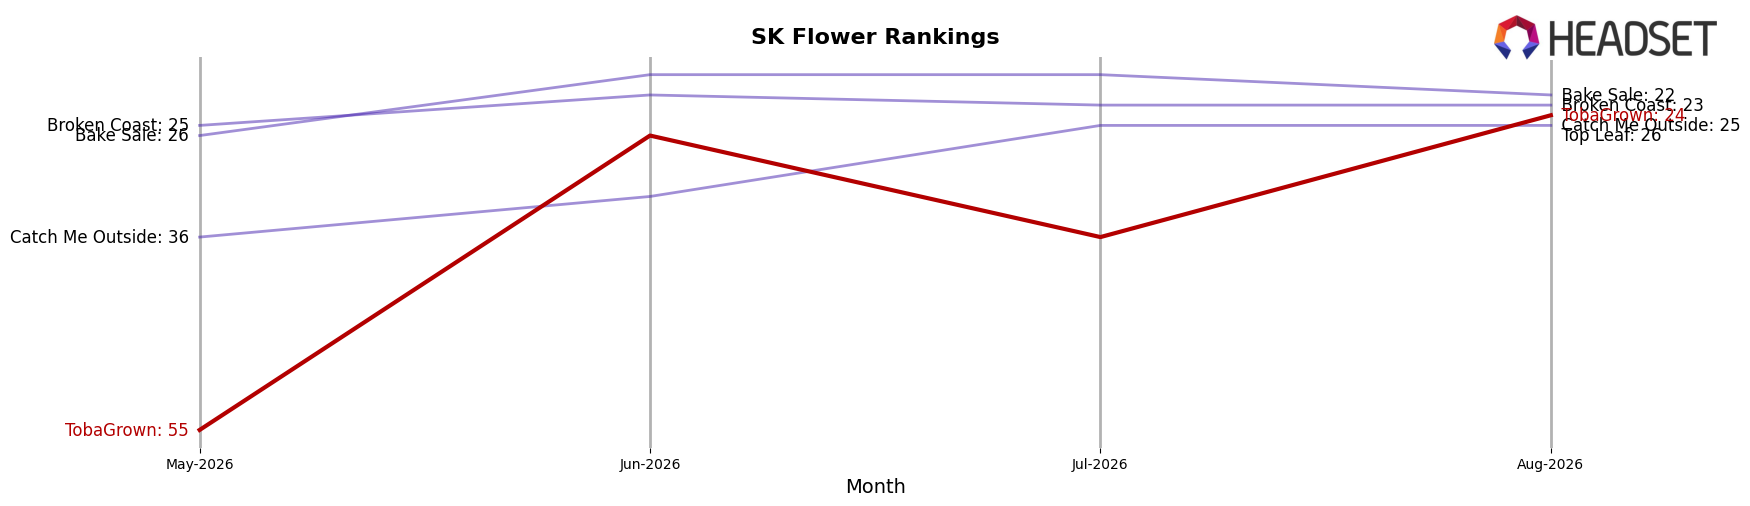
TobaGrown sits at rank #24 in SK Flower in August 2026, improving 17 places year over year from #41 and jumping 31 places since May 2026 when it was #55; that rise coincides with peers consolidating at the top, as Back Forty / Back 40 Cannabis climbed from #3 to #1 while growing sales 124.7% year over year and Big Bag O' Buds advanced from #8 to #2 with 171.2% sales growth, indicating TobaGrown’s ascent to a new peak rank #24 in August 2026 is happening amid faster top-end acceleration and implies continued share pressure unless rank gains convert into velocity beyond the current step-change.
Notable Products
Hybrid Mill A Toba (28g) posted the standout move in August 2026 with a +1349.5% month-over-month surge, entering the top ten at rank 8 while Sativa Mill A Toba (28g) jumped +407.2% to rank 7. Indica Mill A Toba (28g) also climbed +67.8% at rank 10, and together these three 28g Flower SKUs indicate a bulk-size pivot within the top ten. Tobies Pre-Roll 5-Pack (2.5g) held rank 1 with +4.5% MoM while Tobies Pre-Roll 10-Pack (5g) slipped -5.7% at rank 4, suggesting pre-rolls are steady at the top but ceding momentum to high-volume Flower formats. Four of the top ten are Flower SKUs and three are 28g packs, implying TobaGrown is concentrating mix toward value-oriented ounces to capture heavier basket missions over smaller pack formats.
Top Selling Cannabis Brands






Data for this report comes from real-time sales reporting by participating cannabis retailers via their point-of-sale systems, which are linked up with Headset’s business intelligence software. Headset’s data is very reliable, as it comes digitally direct from our partner retailers. However, the potential does exist for misreporting in the instance of duplicates, incorrectly classified products, inaccurate entry of products into point-of-sale systems, or even simple human error at the point of purchase. Thus, there is a slight margin of error to consider. Brands listed on this page are ranked in the top twenty within the market and product category by total retail sales volume.

