.svg)

Aug-2026
Sales
Trend
6-Month
Product Count
SKUs
Avg Price
YoY Sales Change
YoY Price Change


Market Insights Snapshot
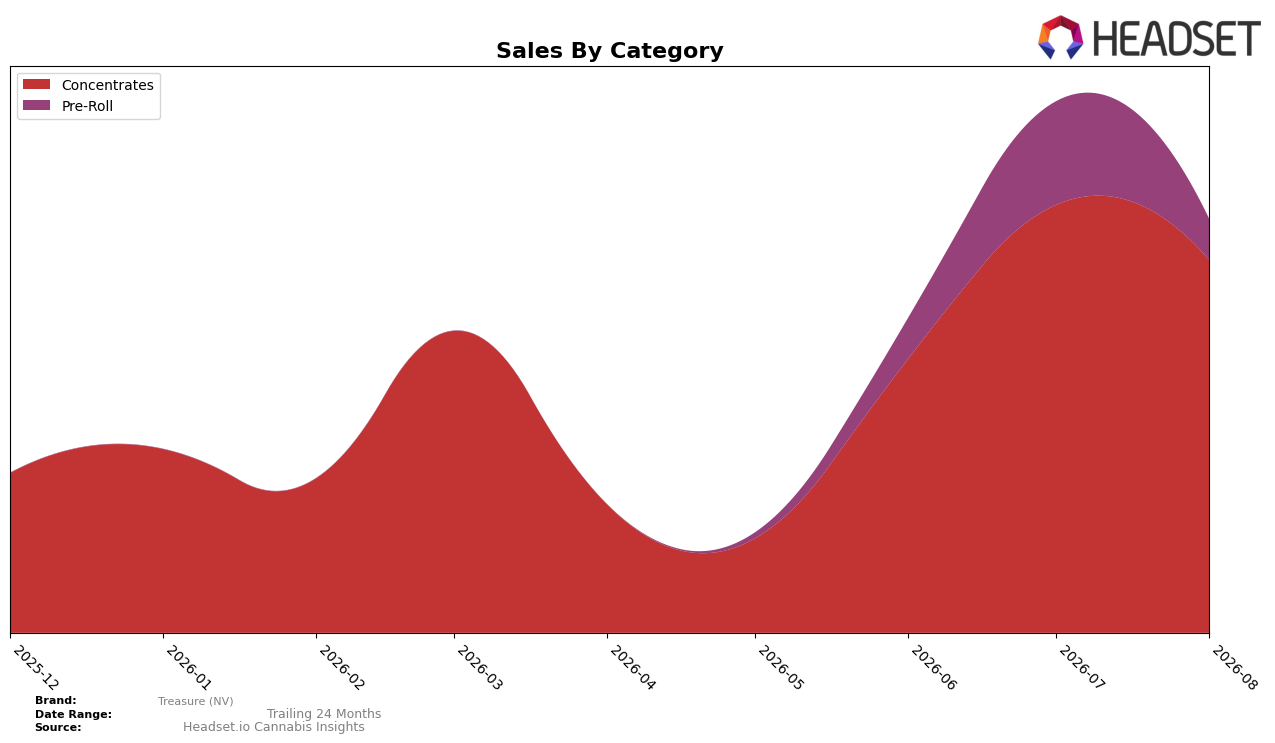
In August 2026, Treasure (NV) concentrated its mix in Concentrates at a 90.10% share while Pre-Roll accounted for 9.90%, with both categories contracting month over month. Concentrates declined 12.85% MoM and Pre-Roll fell 60.37% MoM, while the overall average item price sat at $20.55 and category prices diverged at $20.01 for Concentrates versus $27.20 for Pre-Roll. The brand held rank 22 in Concentrates within Nevada, indicating that the heavier exposure to a shrinking lead category alongside a sharper contraction in a small secondary category tilts the portfolio toward volume preservation over near-term mix expansion.
The 90.10% share in Concentrates paired with a 12.85% MoM decline versus a 60.37% MoM decline in the 9.90% Pre-Roll slice implies risk concentration is manageable but still drags aggregate momentum. With Concentrates priced 26.4% lower than Pre-Roll ($20.01 vs $27.20) and the Concentrates rank at 22 in Nevada, the mix suggests a value-leaning positioning that can defend unit throughput but limits premium mix lift. The pattern implies that stabilizing the secondary Pre-Roll line or marginally increasing premium-priced share could improve revenue efficiency without materially disrupting the core Concentrates rank position.
Competitive Landscape
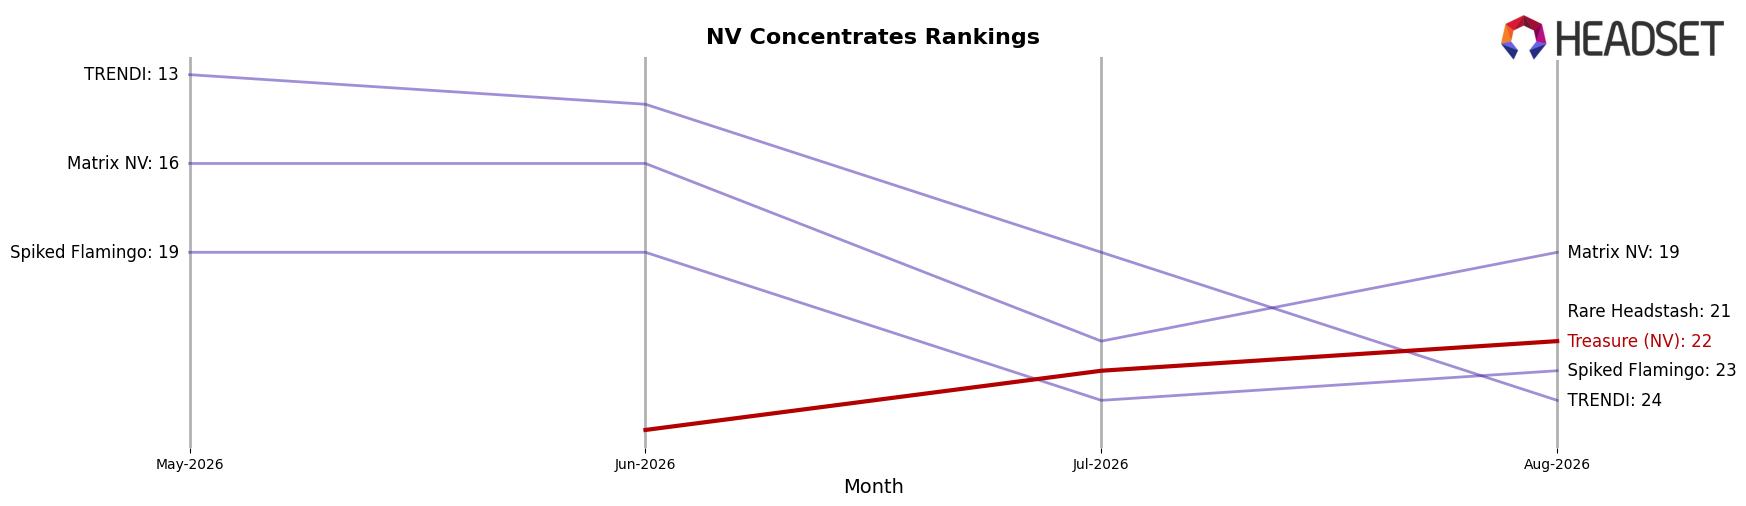
Treasure (NV) is ranked #22 in NV Concentrates in August 2026, improving 13 positions from #35 in May 2026, and reaching a new peak rank of #22 in August 2026 while still trailing leaders like Medizin at #1 and City Trees at #3; notably, Medizin held #1 year over year but saw sales decline 42.5%, whereas City Trees climbed from #7 to #3 on 70.6% YoY sales growth, indicating Treasure (NV)’s mid-pack rise is occurring amid leadership churn and widening performance dispersion, which implies a timely opening to consolidate share if rank momentum from May 2026 to August 2026 can be converted into sustained placement gains against brands moving up the leaderboard.
Notable Products
Rotten Fruit Live Rosin (1g) posted the steepest move in August 2026 with an -84.2% month-over-month drop while sliding to rank 9, and The Works Live Rosin (1g) fell -53.1% at rank 2, signaling a sharp retrenchment in once core 1g live rosin SKUs. Kitchen Sink Live Rosin (1g) held rank 1 despite a -5.4% decline, whereas Rainbow Treasure Live Rosin (1g) rose +23.4% at rank 7, and four of the top ten are Concentrates that include three 2g rosin variants entering the ranks for the first time. With Food Fight Live Rosin (1g) also down -57.0% at rank 3 and Meatloaf Live Rosin (1g) essentially flat at +1.6% at rank 10, the shift suggests demand is rotating from legacy 1g live rosin toward larger 2g formats. The pattern implies Treasure (NV) is pivoting its product mix toward value-oriented rosin sizes to stabilize rank positions and recapture volume concentration.
Top Selling Cannabis Brands






Data for this report comes from real-time sales reporting by participating cannabis retailers via their point-of-sale systems, which are linked up with Headset’s business intelligence software. Headset’s data is very reliable, as it comes digitally direct from our partner retailers. However, the potential does exist for misreporting in the instance of duplicates, incorrectly classified products, inaccurate entry of products into point-of-sale systems, or even simple human error at the point of purchase. Thus, there is a slight margin of error to consider. Brands listed on this page are ranked in the top twenty within the market and product category by total retail sales volume.

