.svg)


Market Insights Snapshot
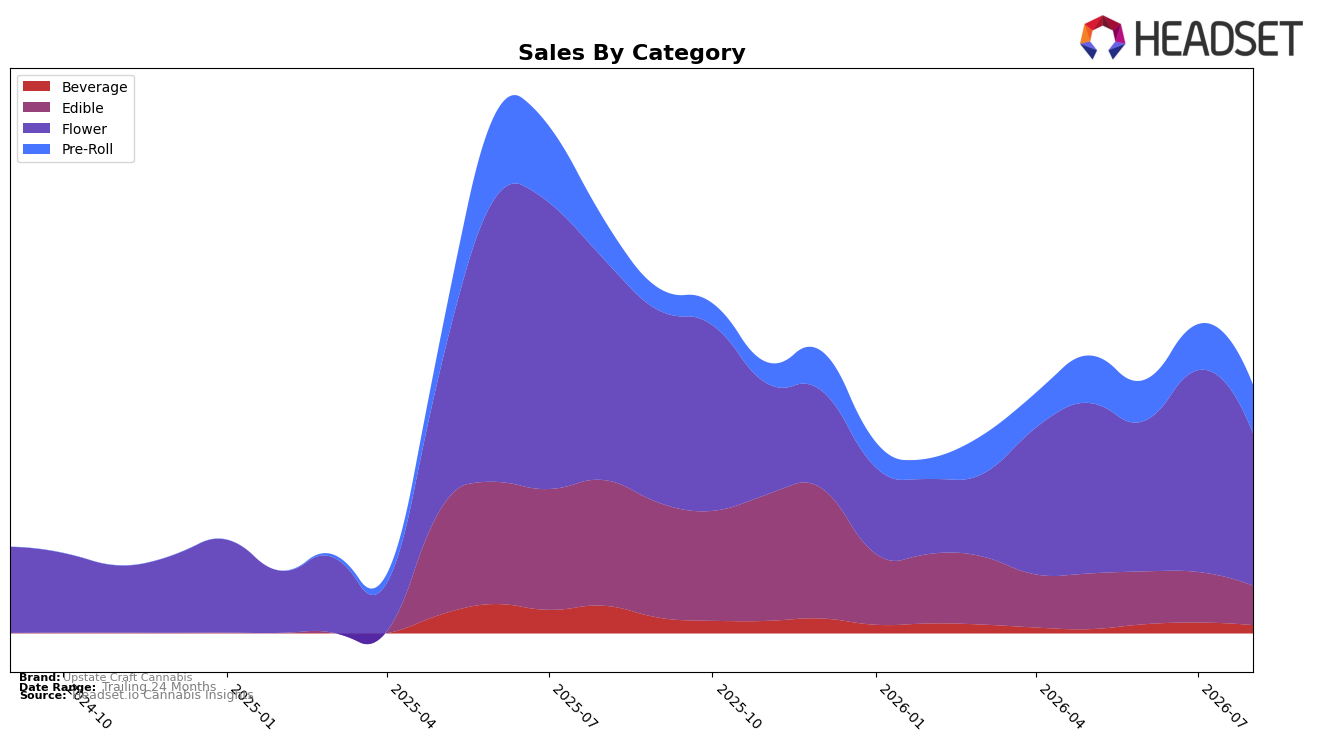
In August 2026, Upstate Craft Cannabis concentrated 61.35% of sales in Flower with year-over-year decline of 31.14% and month-over-month decline of 24.61%, while Pre-Roll rose 22.31% YoY and 5.50% MoM to 19.54% share. Edible fell 68.72% YoY and 21.94% MoM to 15.84% share despite being the stated top category, and Beverage contracted 70.49% YoY and 24.40% MoM to 3.27% share; coupled with a 3.45% YoY decrease in average price to $19.84, the mix tilts away from value-dense ingestibles toward inhalables. The pattern implies a defensive pivot toward Flower volume supported by a growing Pre-Roll contribution, while ingestible lines are shedding demand at a pace that is reshaping the portfolio.
The shift toward Flower dominance alongside Pre-Roll growth, despite a 40.05% brand-level YoY sales decline, positions Upstate Craft Cannabis nearer a convenience-driven inhalable proposition rather than a multi-format platform. With Edible and Beverage shares compressed by 52.88 percentage points in combined YoY sales contraction (−68.72% and −70.49%, respectively) and simultaneous Pre-Roll expansion, the brand’s near-term positioning relies on cross-price elasticity within inhalables as Flower average price sits 42.95% above the overall August 2026 average price while Pre-Roll sits 50.52% below it. This configuration implies margin pressure from mix shift and price dispersion, but also a clearer pathway to traffic capture via Pre-Roll while Flower anchors basket size.
Competitive Landscape
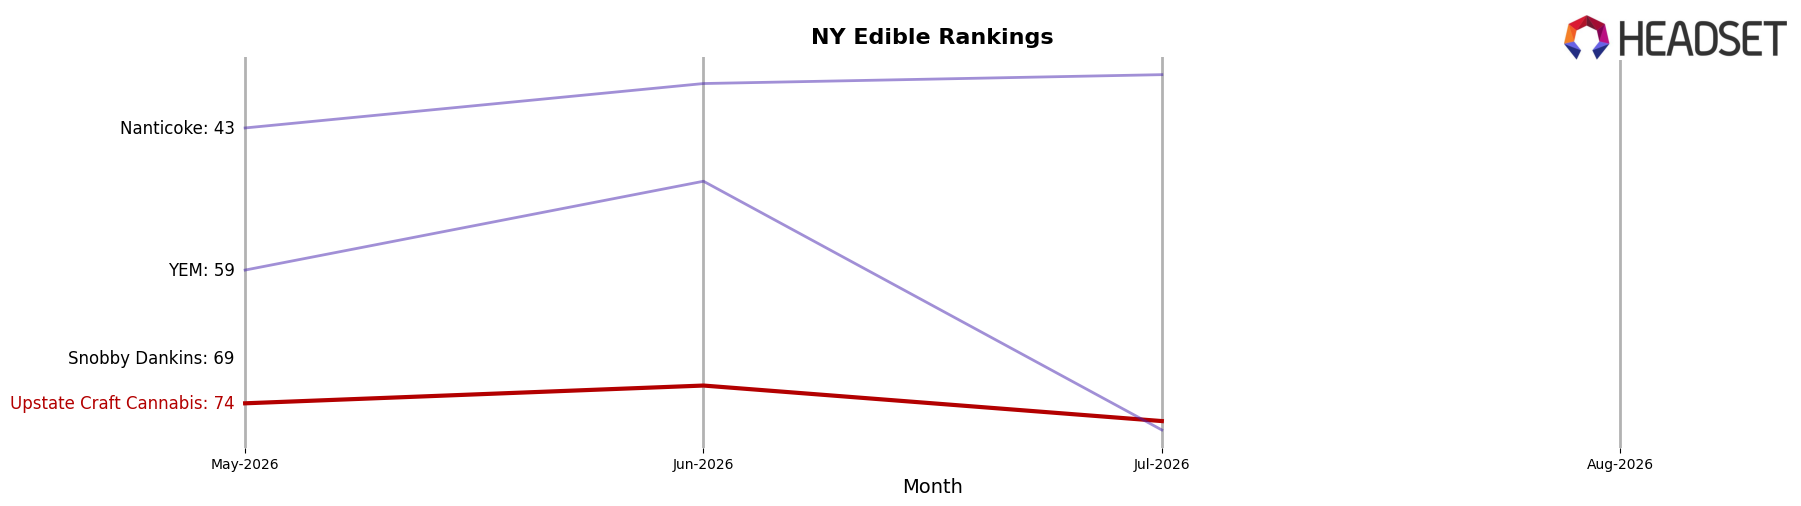
Upstate Craft Cannabis sits at rank #78 in New York Edible for August 2026, down 32 spots year over year from #46, and 4 positions lower than May 2026’s #74; relative to its category peak at #43 in June 2025, the brand is 35 ranks behind. Meanwhile, Off Hours slipped from #1 to #2 with a -24.8% year-over-year sales change, whereas Gron / Grön moved up from #4 to #3 on +14.8% sales growth, indicating that Upstate Craft Cannabis is losing share while mid-top competitors are consolidating positions. With a -32 rank delta year over year and a -4 slide versus three months prior, the trajectory implies that without a pivot in assortment or pricing to regain distribution velocity, Upstate Craft Cannabis is likely to continue ceding rank to upward-moving incumbents.
Notable Products
Afternoon Delight Gummies 10-Pack (100mg) posted the steepest decline in August 2026 at -49.2% while falling to rank 10, and Sub Zero (3.5g) contracted -33.4% at rank 2, signaling demand rotation away from certain legacy ingestibles and a leading Flower SKU. In contrast, Sweet Jealousy Pre-Roll (1g) climbed +49.1% to rank 4 and Blueberry Muffins Pre-Roll (0.7g) jumped +47.4% to rank 1, indicating share capture within Pre-Rolls as that format outpaces Edibles, where Moonlight Gummies 10-Pack (100mg) slid -13.1% to rank 6. Three Flower SKUs sit in the top 10 with mixed trajectories as Blue Lobster (3.5g) dropped -40.0% to rank 9 while Blue Dream (3.5g) eased -3.6% at rank 7 and Gary Payton (3.5g) held at rank 5 with no MoM read, pointing to SKU-specific volatility rather than a uniform category trend. The pattern implies Upstate Craft Cannabis is leaning into faster-turn Pre-Rolls while pruning or repositioning lagging Edibles to stabilize mix and margin depth, despite Flower needing tighter SKU curation.
Top Selling Cannabis Brands






Data for this report comes from real-time sales reporting by participating cannabis retailers via their point-of-sale systems, which are linked up with Headset’s business intelligence software. Headset’s data is very reliable, as it comes digitally direct from our partner retailers. However, the potential does exist for misreporting in the instance of duplicates, incorrectly classified products, inaccurate entry of products into point-of-sale systems, or even simple human error at the point of purchase. Thus, there is a slight margin of error to consider. Brands listed on this page are ranked in the top twenty within the market and product category by total retail sales volume.

