.svg)

Sep-2026
Sales
Trend
6-Month
Product Count
SKUs
Avg Price
YoY Sales Change
YoY Price Change


Market Insights Snapshot
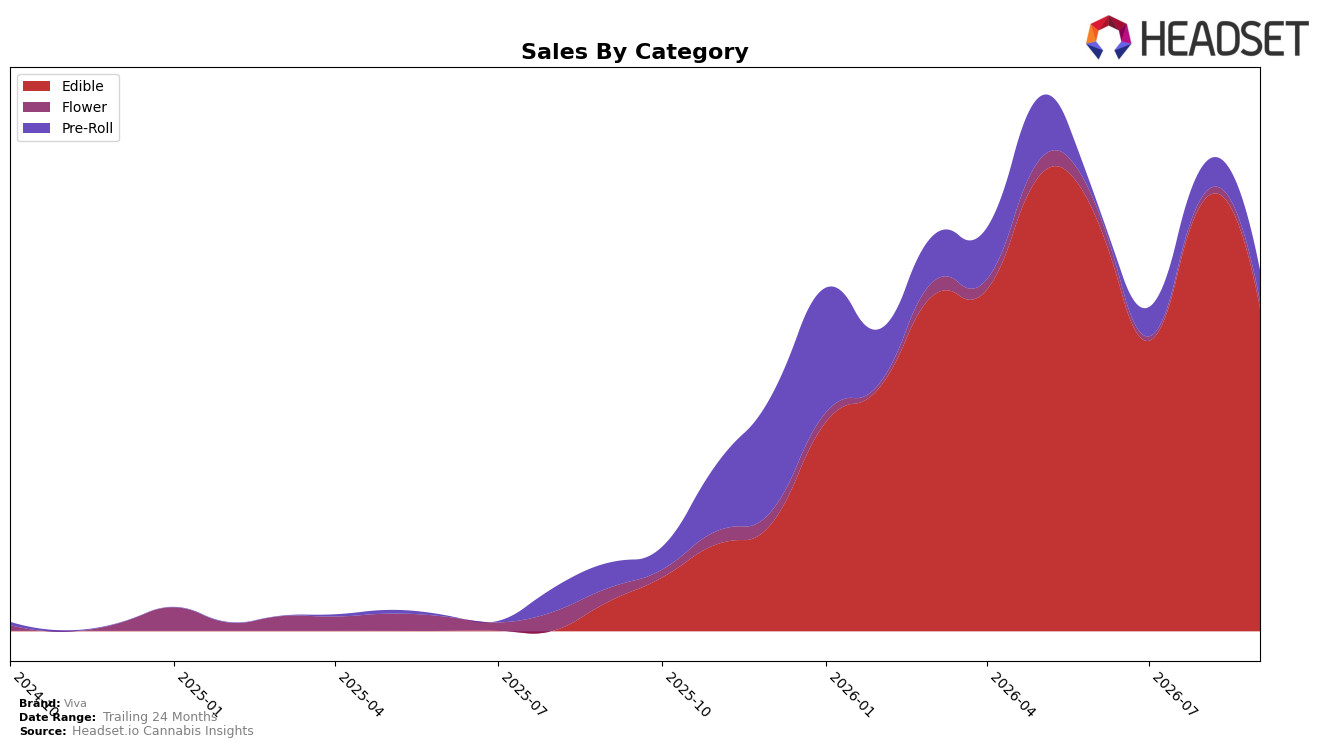
Viva concentrated 89.66% of September 2026 sales in Edible, up 1,010.79% year over year but down 25.15% month over month, while Pre-Roll held 8.47% share with 22.79% YoY growth and a 2.96% MoM uptick; Flower sat at 1.87% share with a 49.51% YoY decline but a 14.68% MoM lift. Average price rose 29.09% YoY to $43.57 as the Edible average reached 48.63, juxtaposed with a lower Pre-Roll average of 20.53; this mix, alongside a Connecticut Edible rank of 12, implies Viva is trading into higher-priced Edible volume while absorbing short-term MoM volatility and ceding only limited space to lower-priced formats.
The tilt toward Edible at 89.66% share, paired with Pre-Roll’s modest 8.47% foothold and Flower’s 1.87% niche, positions Viva as an Edible-led specialist whose rank of 12 in Connecticut Edible can climb if the 25.15% MoM dip stabilizes against the four-digit YoY surge. With overall brand sales up 435.74% YoY and Edible pricing at a premium versus Pre-Roll, the mix suggests Viva is prioritizing margin-accretive formats and can leverage Pre-Roll’s 2.96% MoM growth and Flower’s 14.68% MoM rebound as insulation, implying a strategy where Edible anchors share and the inhalable SKUs act as acquisition and retention channels.
Competitive Landscape
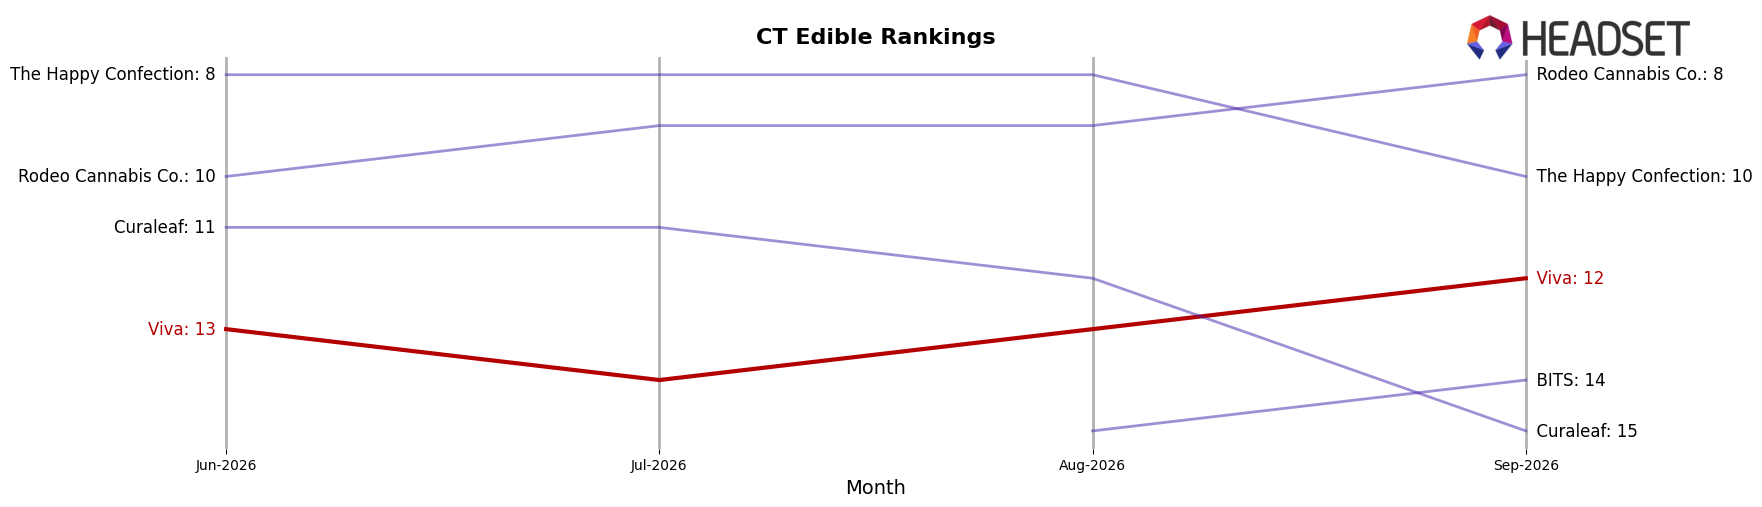
Viva sits at rank #12 in September 2026, improving 6 positions from #18 year over year, while slipping 1 spot from #13 three months ago; this places Viva at its peak rank of #12 in September 2026 even as category leaders reshuffle. Soundview moved up from #2 to #1 despite a -12.86% year-over-year sales change, whereas Camino climbed from #4 to #2 with +130.82% sales growth, and Encore Edibles fell from #1 to #4 with a -55.69% slide; against that churn, Viva’s rise from #18 to #12 and near-term dip from #13 to #12 suggest momentum that is improving on a yearly basis but still vulnerable to faster-moving competitors expanding share.
Notable Products
Mystic Citrus RSO Gummies 20-Pack (500mg) posted the steepest movement in September 2026 with a -70.21% MoM drop and fell to rank 3, while Strawberry Fiesta RSO Gummies 20-Pack (500mg) also declined -22.23% but held rank 1, indicating demand compression within the RSO gummy line. Watermelon Z Infused Pre-Roll 5-Pack (2.5g) in rank 2 inched up +2.96% MoM, and Sour Diesel (14g) at rank 4 gained +14.72% MoM, meaning non-edible formats are taking relative share as two Edible SKUs occupy 2 of the top 3 yet both contracted. With two Edible SKUs concentrated in the top three but moving downward while Pre-Roll and Flower inch upward, the mix points to Viva reallocating attention from RSO-centric Edibles toward inhalables to stabilize rank and diversify volatility.
Top Selling Cannabis Brands






Data for this report comes from real-time sales reporting by participating cannabis retailers via their point-of-sale systems, which are linked up with Headset’s business intelligence software. Headset’s data is very reliable, as it comes digitally direct from our partner retailers. However, the potential does exist for misreporting in the instance of duplicates, incorrectly classified products, inaccurate entry of products into point-of-sale systems, or even simple human error at the point of purchase. Thus, there is a slight margin of error to consider. Brands listed on this page are ranked in the top twenty within the market and product category by total retail sales volume.

