.svg)


Market Insights Snapshot
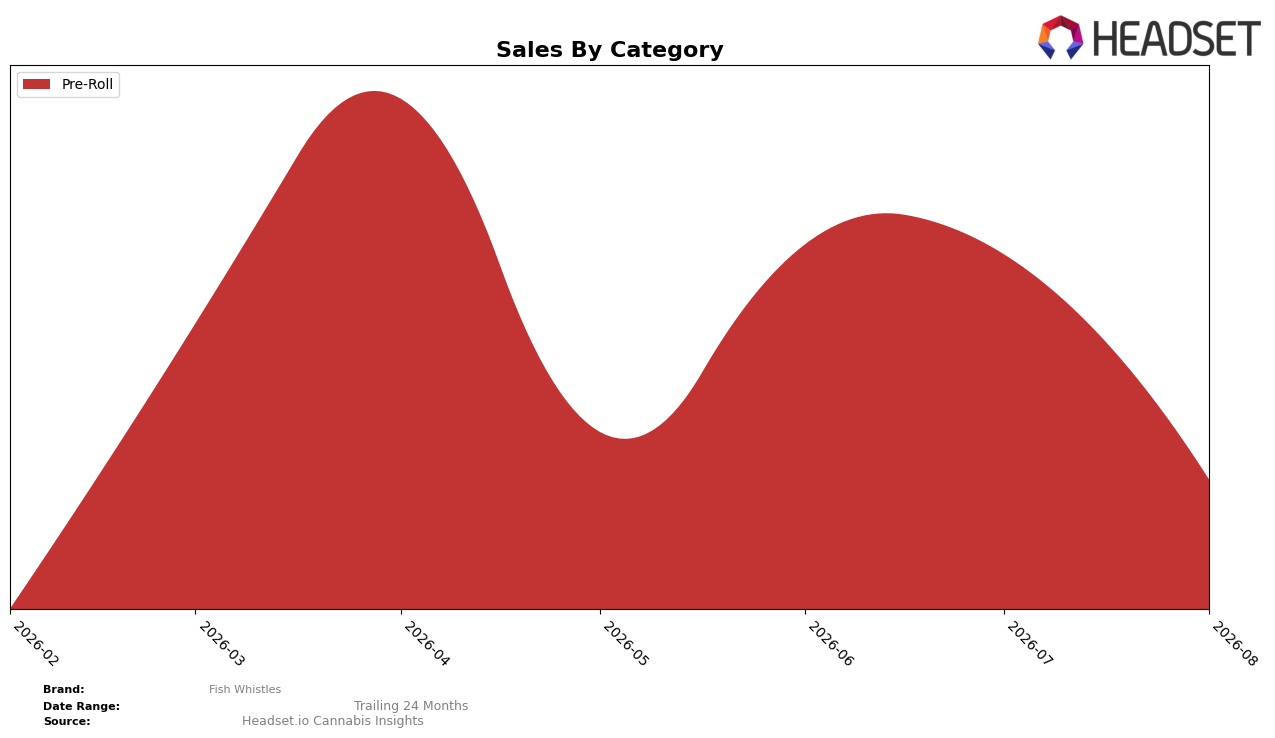
In August 2026, Fish Whistles operated as a single-category brand with Pre-Roll accounting for 100.0% of sales, while month-over-month volume contracted by 52.82% alongside an average price of $21.69. Within Ohio Pre-Roll, the brand held rank 42, a position that places it below the median tier for discoverability and repeat consideration at the shelf. The pattern implies a concentration risk: full exposure to Pre-Roll and a 52.82% MoM pullback signal sensitivity to monthly demand swings without diversification to buffer volatility.
The combination of a 100.0% category share and rank 42 in Ohio Pre-Roll indicates a scale ceiling: the brand’s single-lane strategy compresses reach even as competitors move across adjacent form factors, and the 52.82% MoM decline suggests limited elasticity to promotional or seasonal shifts. The implication is a positioning pivot is required—either trading up within Pre-Roll to improve rank from 42 into the 30s or introducing a secondary category to dilute the 100.0% exposure and reduce the probability of another 50%+ monthly swing.
Competitive Landscape
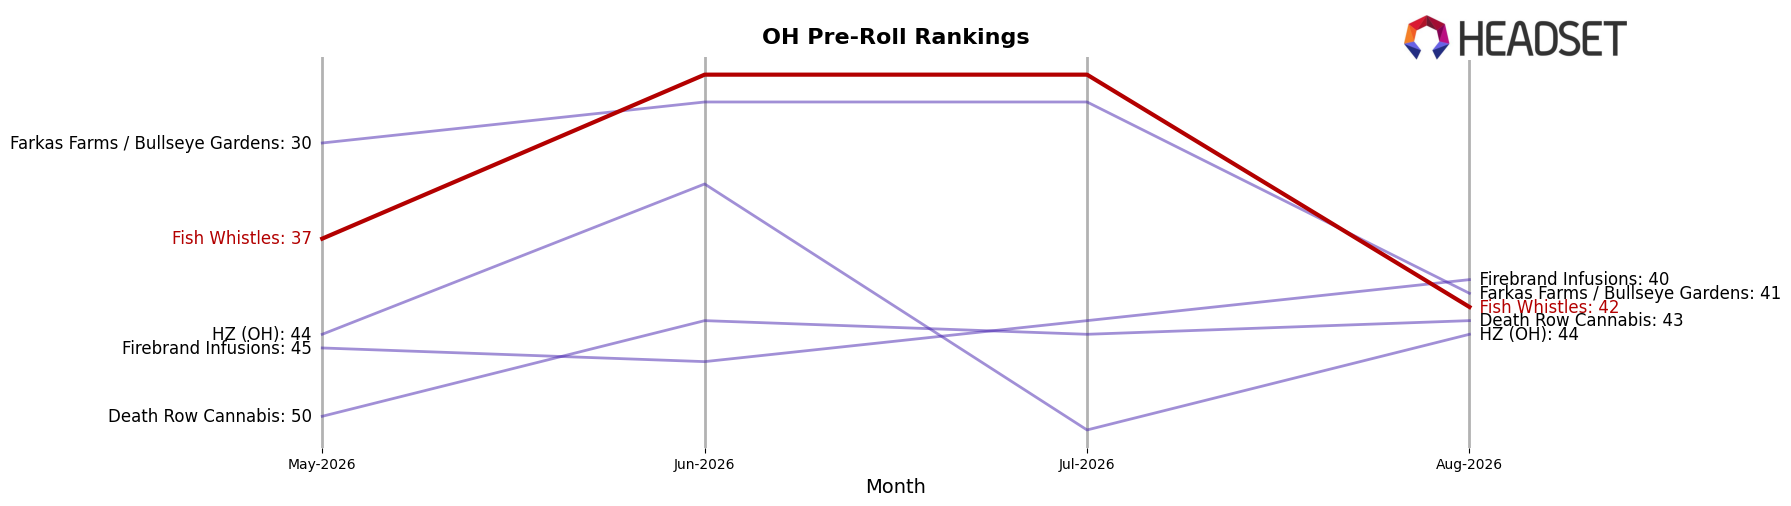
Fish Whistles sits at rank 42 in OH Pre-Roll for August 2026, down 5 spots from rank 37 in May 2026 and 25 places below its peak at rank 17 in April 2026; the three-month slippage of 14% in rank position density (from top-37 to outside top-40) coincides with a peak-to-current drop of 147% in ordinal distance from the category lead. Meanwhile, Jeeter occupies rank 1 while Fish Whistles is at 42, a 41-place gap, and Buckeye Relief advanced to rank 2 with a 670.4% year-over-year sales increase, indicating competitors are moving upward as Fish Whistles moves downward. The pattern implies Fish Whistles is transitioning from a mid-tier peak in April 2026 toward a lower-tier position by August 2026, signaling a trajectory that requires either mix or distribution shifts to arrest further rank erosion.
Notable Products
Orange Banana Cookies Pre-Roll 5-Pack (1.75g) posted the steepest decline at -90.57% while sliding to rank 6, contrasted by Candy Splash Pre-Roll 5-Pack (1.75g) surging +969.09% into rank 4; this spread indicates volatile demand within a concentrated format. Blueberry Bubble Gum Pre-Roll 5-Pack (1.75g) climbed +107.53% to rank 2 as Caribbean Durbz Pre-Roll 5-Pack (1.75g) fell -49.48% yet held rank 1 with $29,872, and five of the top six are Pre-Roll 5-Packs from the same family. The simultaneous +60.12% move for Dream Junky Pre-Roll 5-Pack (1.75g) at rank 3 and the -77.63% for GovernMint Oasis Pre-Roll 5-Pack (1.75g) at rank 5 imply flavor-driven substitution rather than category expansion. The pattern suggests Fish Whistles is consolidating around a few breakout Pre-Roll 5-Packs while cycling out underperforming SKUs, pointing to a tighter, flavor-rotated portfolio strategy.
Top Selling Cannabis Brands






Data for this report comes from real-time sales reporting by participating cannabis retailers via their point-of-sale systems, which are linked up with Headset’s business intelligence software. Headset’s data is very reliable, as it comes digitally direct from our partner retailers. However, the potential does exist for misreporting in the instance of duplicates, incorrectly classified products, inaccurate entry of products into point-of-sale systems, or even simple human error at the point of purchase. Thus, there is a slight margin of error to consider. Brands listed on this page are ranked in the top twenty within the market and product category by total retail sales volume.

