.svg)

Aug-2026
Sales
Trend
6-Month
Product Count
SKUs
Avg Price
YoY Sales Change
YoY Price Change


Where to Buy
Flavor Flow Labs is stocked at 52 licensed dispensaries across Massachusetts, with the deepest coverage in Boston, Fall River, Attleboro, Ayer, and Blackstone. Search by ZIP code or city below to find the closest one, or filter by product type if you are after a specific format.
Market Insights Snapshot
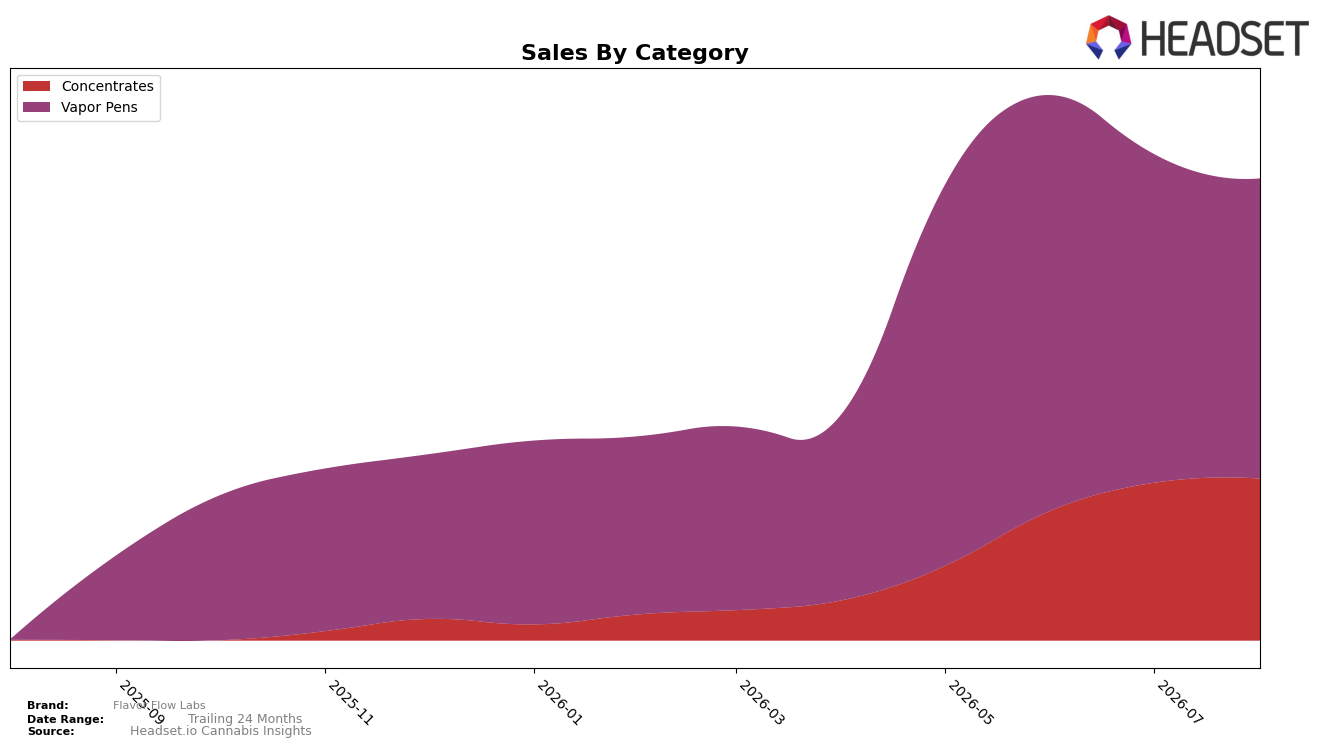
Flavor Flow Labs concentrated its August 2026 mix in Vapor Pens at 64.97% share while Concentrates held 35.03% share, with Vapor Pens sliding month over month by 8.72% as Concentrates rose 2.66%. The implied YoY surge in Concentrates of 34,513.10% against a null Vapor Pens YoY read means the growth headline came from a newer or rapidly scaling Concentrates line, even as the average price climbed 22.26% to $36.70. In Massachusetts, the brand’s top market, Vapor Pens rank at position 75 and the category’s 34.04 average price sits below Concentrates’ 42.93, signaling a migration toward a higher-priced segment while the core Vapor Pens base retrenches. The pattern implies Flavor Flow Labs is reallocating demand toward Concentrates where pricing power is higher, accepting Vapor Pens volume softness to lift mix quality.
The month-over-month -8.72% decline in Vapor Pens share contribution alongside a 2.66% Concentrates uptick, combined with a 64.97% vs 35.03% split, repositions the portfolio toward premium-extract dynamics despite a lower rank of 75 in Vapor Pens. With August 2026 average price up 22.26% and Concentrates carrying a higher ticket at 42.93 versus 34.04 for Vapor Pens, the brand tilts toward margin accretion rather than rank pursuit in its top Massachusetts Vapor Pens lane. The pattern implies the brand is using Concentrates’ explosive year-over-year expansion of 34,513.10% to offset softness in its 75th-place Vapor Pens position and build pricing-led defensibility.
Competitive Landscape
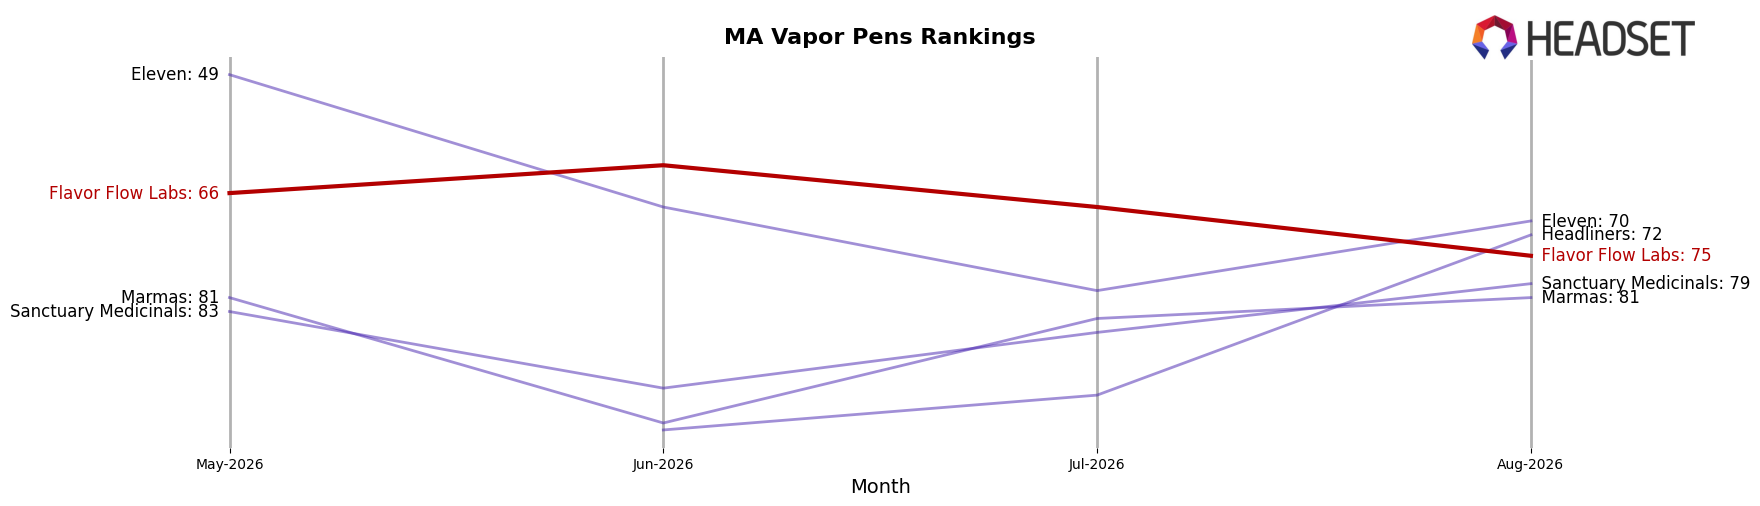
Flavor Flow Labs sits at rank #75 in MA Vapor Pens in August 2026, down 9 positions from #66 in May 2026 and 13 positions off its peak at #62 in June 2026; versus top movers, Dime Industries advanced from #6 to #4 and Jeeter climbed from #33 to #5 while Flavor Flow Labs slipped from #66 to #75, indicating relative share is being ceded to faster-rising competitors. With category leaders stable at the top—Fernway holding #1 year over year and Select steady at #2 despite a -12.77% sales YoY change—Flavor Flow Labs’ downward rank change of -9 since May 2026 and a -13 gap from its June 2026 peak imply the brand is losing distribution or velocity where headroom exists, and the trajectory points to further erosion unless it re-enters the top-60 range rapidly.
Notable Products
Grape Zorilla Live Hash Rosin Disposable (0.5g) posted the largest move in August 2026 with an 84.0% month-over-month gain and jumped into a shared rank position at 3, while Coughy Cake Live Hash Rosin Disposable (0.5g) fell 28.5% month-over-month yet held rank 1. Juniper Jive Live Hash Rosin Disposable (0.5g) declined 62.6% month-over-month to rank 7, signaling volatility within the same Live Hash Rosin Disposable family that also contains the rank 2 Cosmic Rocket Punch at +17.6% month-over-month. With eight of the top ten sitting in Vapor Pens and only two in Concentrates, the product mix implies Flavor Flow Labs is leaning into Live Hash Rosin disposables despite uneven SKU-level swings, prioritizing high-velocity pen formats over steady but lower-rank concentrates; the concentration is reinforced by multiple top-5 positions in Vapor Pens against a single Concentrates entrant above rank 8 and a single month’s revenue peak of $8,707.
Top Selling Cannabis Brands






Data for this report comes from real-time sales reporting by participating cannabis retailers via their point-of-sale systems, which are linked up with Headset’s business intelligence software. Headset’s data is very reliable, as it comes digitally direct from our partner retailers. However, the potential does exist for misreporting in the instance of duplicates, incorrectly classified products, inaccurate entry of products into point-of-sale systems, or even simple human error at the point of purchase. Thus, there is a slight margin of error to consider. Brands listed on this page are ranked in the top twenty within the market and product category by total retail sales volume.

