.svg)


Where to Buy
Flora Arbor is stocked at 96 licensed dispensaries across Illinois, with the deepest coverage in Chicago, Joliet, Quincy, Schaumburg, and Springfield. Search by ZIP code or city below to find the closest one, or filter by product type if you are after a specific format.
Market Insights Snapshot
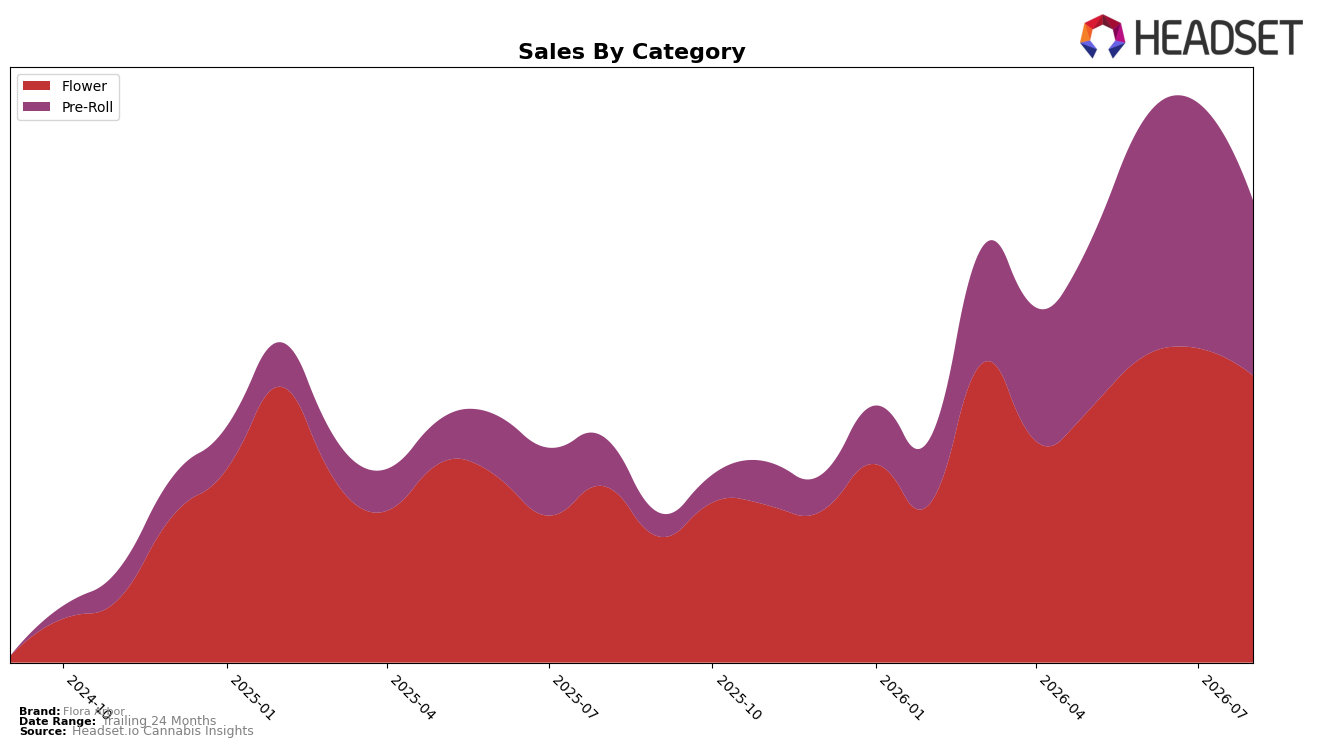
In August 2026, Flower held 62.13% share with year-over-year growth of 62.90% but month-over-month decline of 8.68%, while Pre-Roll reached 37.87% share with year-over-year growth of 257.61% and month-over-month decline of 28.71%. Despite brand-level sales up 105.21% year over year alongside a 39.94% drop in average price, Flora Arbor’s category mix tilted toward Pre-Roll on a yearly basis even as both categories contracted month over month, implying a price-led volume strategy that is expanding reach annually but cooling sequentially as discount-driven pull eases.
Within Flower, a rank of 38 in Illinois coexists with a 62.90% year-over-year lift and an 8.68% month-over-month dip, while Pre-Roll’s 257.61% year-over-year surge contrasts with a 28.71% month-over-month pullback; together with a 62.13% vs. 37.87% share split, this points to momentum concentrated in accessible formats that are sensitive to promotional cadence. The pattern implies Flora Arbor is trading margin for scale via lower average prices and leaning into Pre-Roll acquisition, but to sustain rank gains in Flower and defend recent share, the brand likely needs steadier pricing architecture and more consistent activation to reduce the sharp month-over-month volatility.
Competitive Landscape
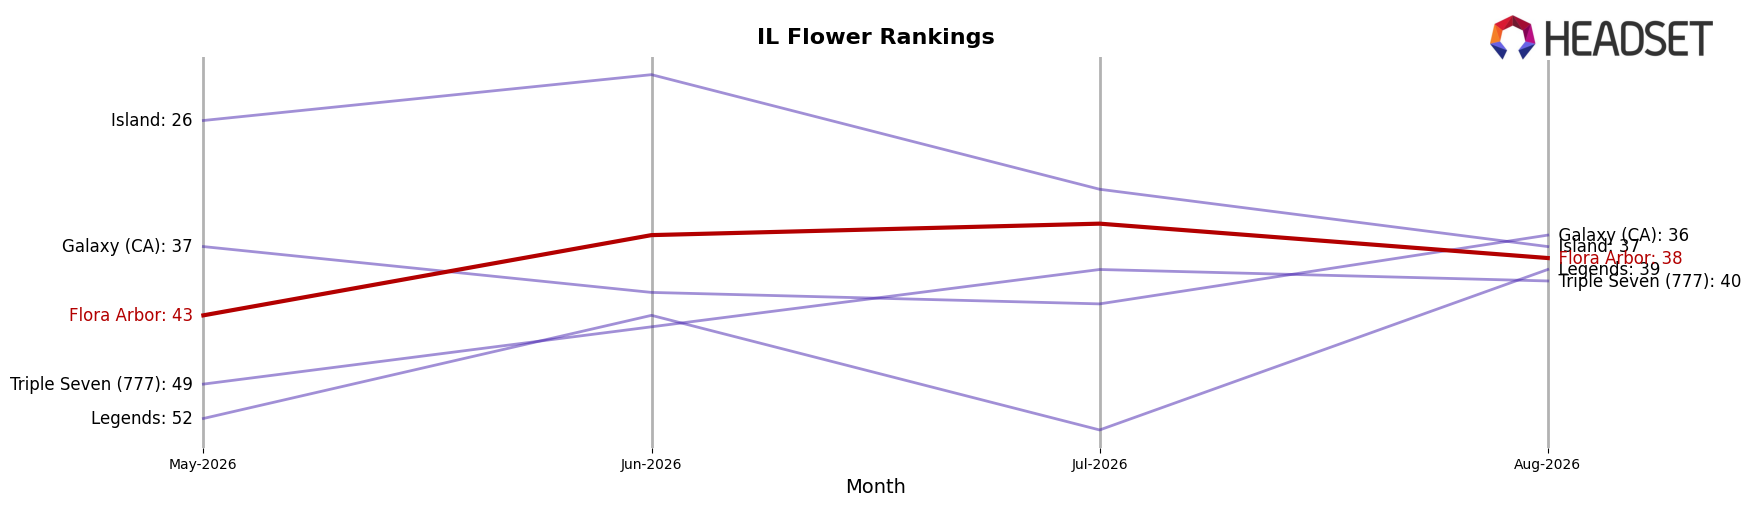
Flora Arbor sits at rank #38 in IL Flower in August 2026, improving 8 positions YoY from #46 and 5 positions since May 2026, while its three-month move from #43 to #38 coincided with a brief peak at #35 in July 2026; in contrast, High Supply / Supply held #1 despite a -10.1% YoY sales change and RYTHM held #2 with +36.5% YoY growth, and The Botanist surged from #29 to #4 alongside +482.1% YoY, indicating Flora Arbor’s gradual rank gains are occurring amid aggressive upward shifts at the top that raise the competitive bar for sustained advancement.
Notable Products
Lemon Cherry Gelato Pre-Roll (1g) posted the steepest movement in August 2026 with a -65.3% MoM slide and fell to rank 6, while Black Cherry Buff Pre-Roll (1g) also contracted -11.9% at rank 3. In contrast, Permanent Chimera Pre-Roll (1g) rose 24.9% to rank 4 and Disco Fries Pre-Roll (1g) gained 13.8% at rank 2, indicating volatility clustered inside the top five. With eight of the top ten coming from the Pre-Roll family and Grand Master Sexy Pre-Roll (1g) holding rank 1 on just +4.1% MoM, the mix implies reliance on a concentrated pre-roll lineup that is rotating share between SKUs rather than expanding the category’s overall throughput.
Top Selling Cannabis Brands






Data for this report comes from real-time sales reporting by participating cannabis retailers via their point-of-sale systems, which are linked up with Headset’s business intelligence software. Headset’s data is very reliable, as it comes digitally direct from our partner retailers. However, the potential does exist for misreporting in the instance of duplicates, incorrectly classified products, inaccurate entry of products into point-of-sale systems, or even simple human error at the point of purchase. Thus, there is a slight margin of error to consider. Brands listed on this page are ranked in the top twenty within the market and product category by total retail sales volume.

