.svg)
Aug-2026
Sales
Trend
6-Month
Product Count
SKUs
Avg Price
YoY Sales Change
YoY Price Change


Where to Buy
High Grass Farms is stocked at 66 licensed dispensaries across New Jersey, with the deepest coverage in Atlantic City, Jersey City, Egg Harbor City, Franklin Township, and Mount Laurel. Search by ZIP code or city below to find the closest one, or filter by product type if you are after a specific format.
Market Insights Snapshot
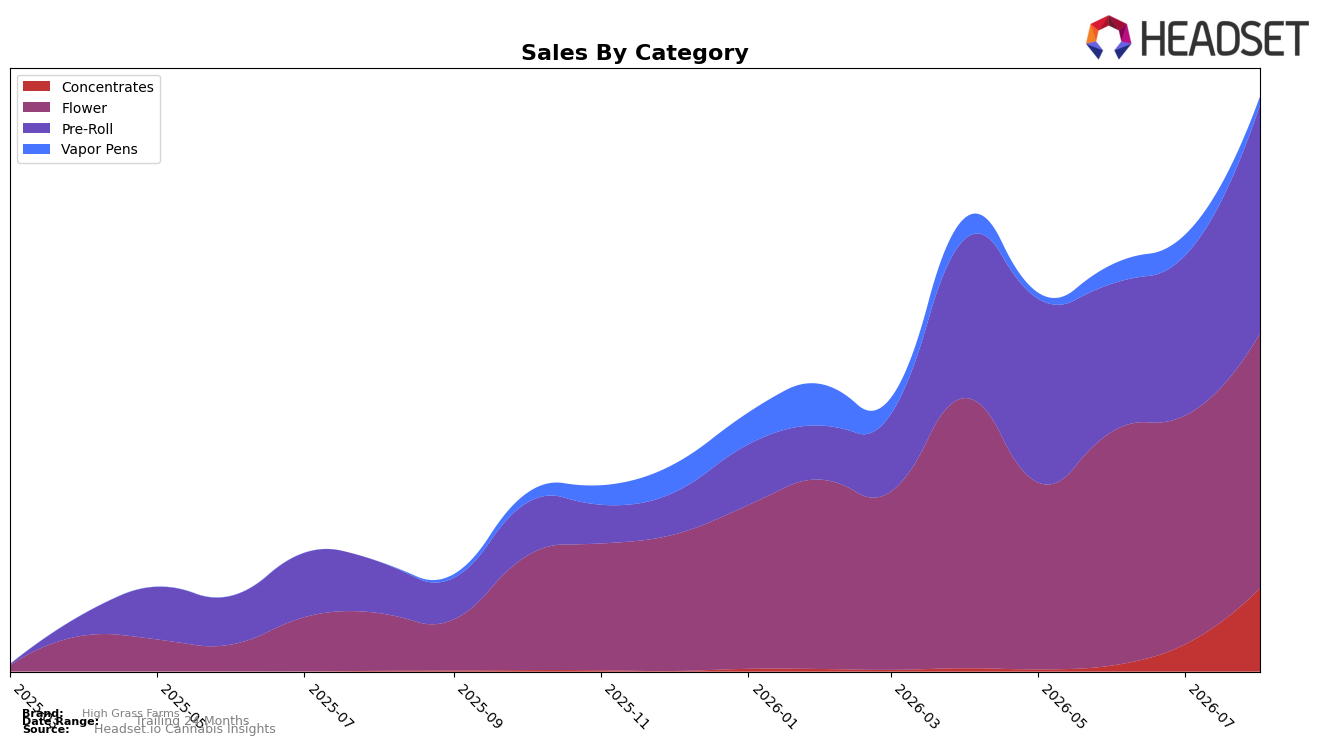
High Grass Farms concentrated sales in Flower at 44.36% share and Pre-Roll at 39.76% share in August 2026, with Concentrates at 14.44% and Vapor Pens at 1.43%; within Flower, year-over-year growth hit 343.72% and month-over-month rose 11.44%, while Pre-Roll advanced 346.42% YoY and 42.86% MoM. Concentrates expanded 14,777.90% YoY and 205.52% MoM off a smaller base as Vapor Pens contracted 60.14% MoM with no YoY figure, and the brand sat at rank 55 in Flower within New Jersey; the pattern implies a pivot toward inhalables led by Pre-Roll acceleration and a rapid, base-building move in Concentrates while de-emphasizing Vapor Pens.
Average price increased 59.75% YoY to $18.01 while Flower’s average price was $33.92 and Concentrates $34.73, alongside overall brand sales growth of 426.26% YoY and a month-over-month mix tilting 42.86% higher in Pre-Rolls versus 11.44% in Flower; with Concentrates up 205.52% MoM but only 14.44% share, the near-term elasticity risk concentrates in premiumized inhalables rather than low-share Vapor Pens at 1.43%. The rank of 55 in Flower within New Jersey combined with outsized MoM gains in Pre-Rolls indicates headroom to trade up within core inhalables while using Concentrates as a margin-accretive niche, implying positioning as a value-to-premium bridge across Flower and Pre-Roll with selective expansion in Concentrates and a managed retreat from Vapor Pens.
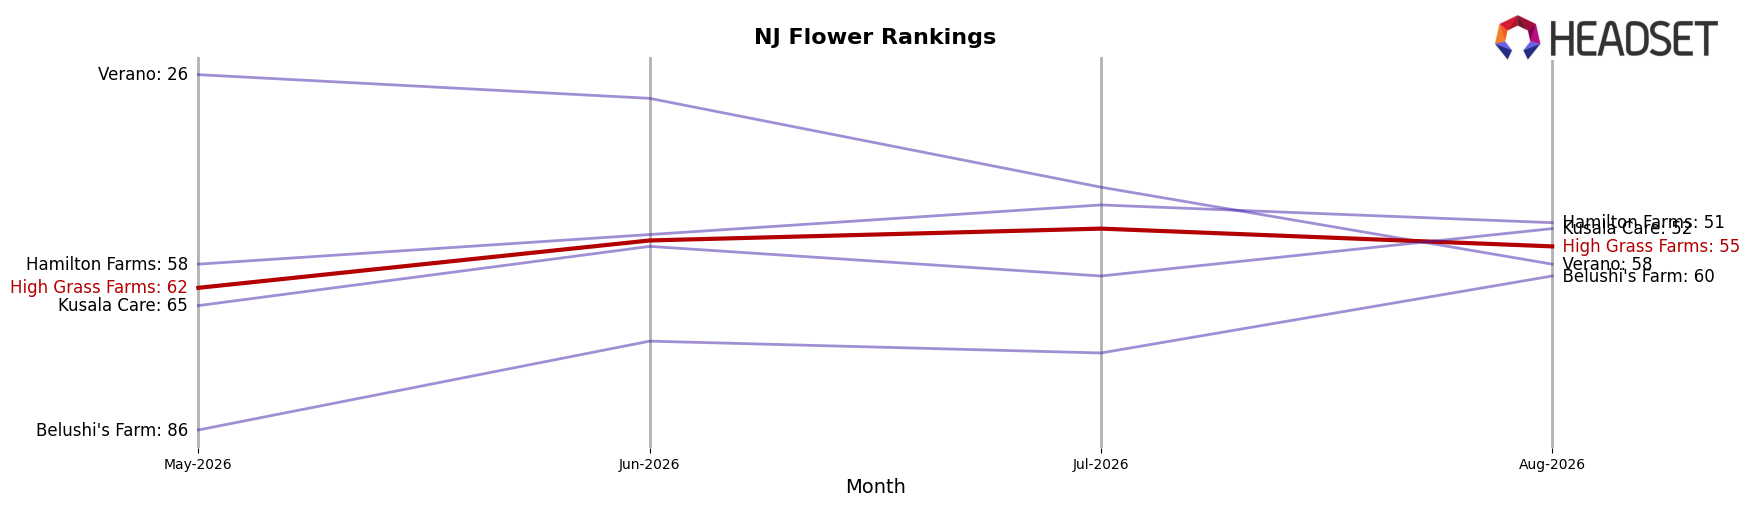
Competitive Landscape
High Grass Farms sits at rank #55 in NJ Flower in August 2026, improving 20 positions from #75 year over year and rising 7 spots from #62 over the last three months; against its own history, it remains 5 ranks off the April 2026 peak at #50 while the market leader Ozone slipped from #2 to #1 with a -18.5% year-over-year sales change and Find. climbed from #5 to #2 with a 40.5% increase. The mix of a double-digit rank gain for High Grass Farms alongside competitors like Good Green jumping from #10 to #3 on +91.6% growth indicates a category where share is consolidating at the top while mid-pack mobility is possible but requires sharper acceleration to convert a #55 position into sustained top-50 presence.
Notable Products
Apple Fritter Pre-Roll (0.5g) posted the standout move in August 2026 with a +229.6% month-over-month surge and climbed into rank 5, while 707 Kush (3.5g) also accelerated at +61.2% MoM to rank 6. In contrast, Apple Fritter (3.5g) fell -16.2% MoM at rank 9 and GMO Rootbeer Pre-Roll (0.5g) slid -24.5% MoM at rank 10, creating a split narrative between the Apple Fritter family across formats. With six of the top ten in the Pre-Roll category, the lineup is tilting toward quick-turn inhalables as growth engines, implying High Grass Farms is consolidating around pre-roll velocity rather than traditional flower weight.
Top Selling Cannabis Brands






Data for this report comes from real-time sales reporting by participating cannabis retailers via their point-of-sale systems, which are linked up with Headset’s business intelligence software. Headset’s data is very reliable, as it comes digitally direct from our partner retailers. However, the potential does exist for misreporting in the instance of duplicates, incorrectly classified products, inaccurate entry of products into point-of-sale systems, or even simple human error at the point of purchase. Thus, there is a slight margin of error to consider. Brands listed on this page are ranked in the top twenty within the market and product category by total retail sales volume.

