.svg)
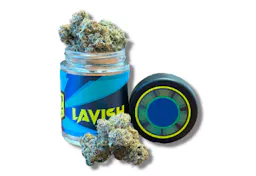


Where to Buy
Lavish is stocked at 21 licensed dispensaries across Washington, with the deepest coverage in Everett, Spokane, Seattle, Tacoma, and Buckley. Search by ZIP code or city below to find the closest one, or filter by product type if you are after a specific format.
Market Insights Snapshot
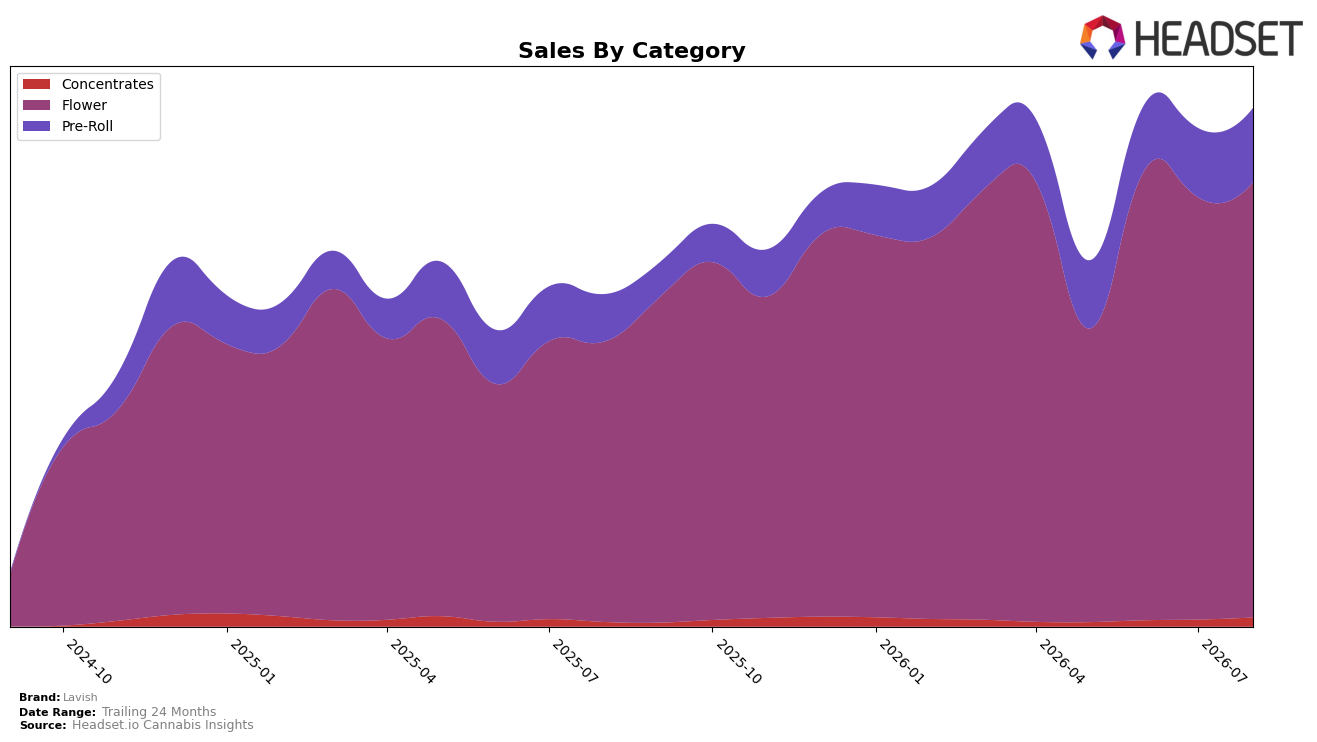
Lavish concentrated 84.00% of August 2026 sales in Flower, with category sales up 55.39% year over year and 3.05% month over month, while Pre-Roll held 14.27% share with 56.65% YoY and 7.38% MoM growth. Concentrates remained small at 1.72% share but expanded 102.77% YoY and 31.10% MoM, indicating the fastest trajectory; average price rose 7.60% YoY to $13.19, while Flower’s average price sat at $20.83. This mix, paired with a Flower rank of 42 in Washington, implies Lavish is anchored to Flower scale but is quietly accelerating in smaller formats that can rebalance mix if sustained.
The surge in Concentrates (31.10% MoM alongside 102.77% YoY) versus slower Flower growth (3.05% MoM and 55.39% YoY) signals an early-stage shift toward higher-velocity niches, while Pre-Roll’s 7.38% MoM and 56.65% YoY provide a middle path for incremental reach. Given the 84.00% Flower reliance and a Washington Flower rank of 42, the pattern implies Lavish’s near-term positioning is volume-led in Flower with optionality: continued Concentrates and Pre-Roll expansion could lift rank by diversifying demand pockets without overexposing average price, which increased 7.60% YoY.
Competitive Landscape
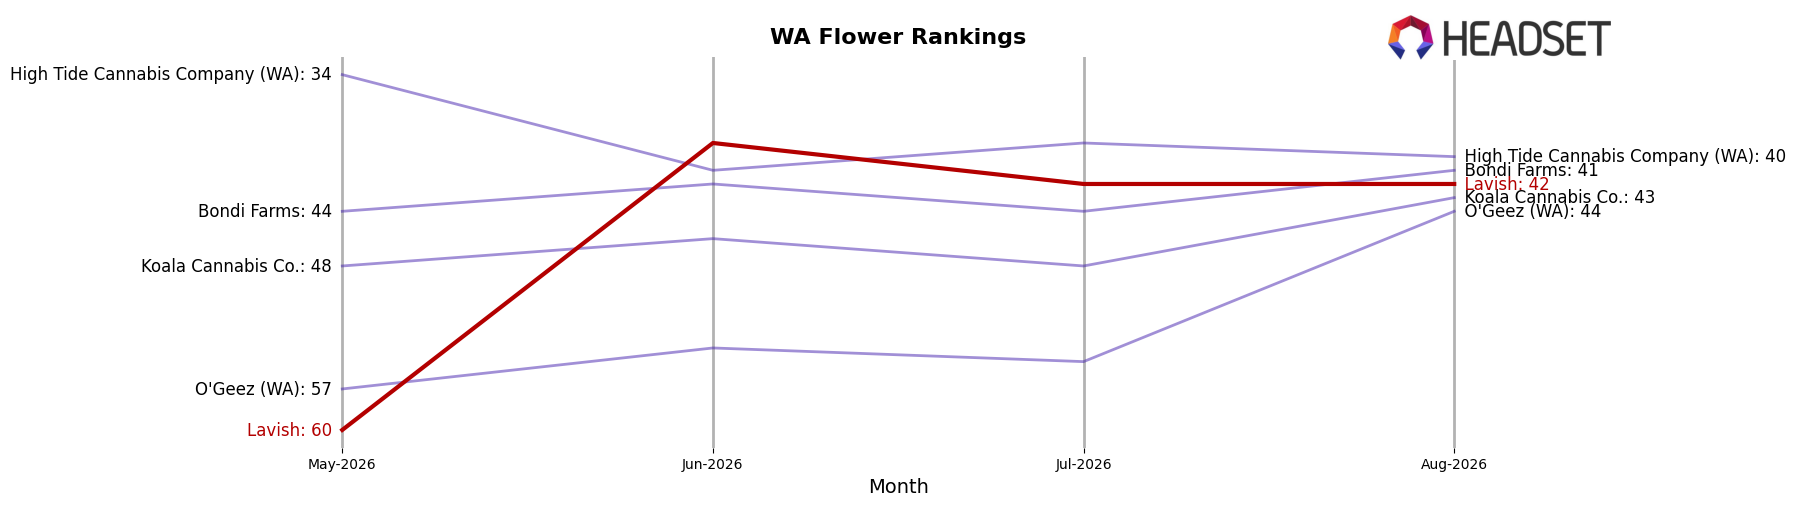
Lavish is ranked #42 in Washington Flower in August 2026, improving 26 positions from #68 year over year, and climbing 18 spots from #60 in May 2026, while also sitting three places below its peak of #39 in June 2026; meanwhile, Phat Panda held #1 both this year and last year with a 23.7% YoY sales increase, and Mama J's edged up from #4 to #3 despite a 2.2% YoY sales decline, indicating Lavish’s mid-year surge is translating into rank gains but still trails leaders consolidating top-tier positions.
Notable Products
Jokerz (3.5g) posted the steepest movement in August 2026 with a -39.99% month-over-month decline that pushed it to rank 9, while Dripped Runtz Pre-Roll 2-Pack (1g) also fell -19.08% at rank 3, indicating demand cooled for heavier-hitting SKUs tied to the Jokerz lineage. In contrast, Runtz (3.5g) rose +22.39% to rank 2, and Electric Lime Pre-Roll 2-Pack (1g) held rank 1 with $3,335 in sales, creating a split where momentum favored core Flower over certain infused or flavor-forward Pre-Rolls. With six of the top ten sitting in the Pre-Roll category yet two of those Pre-Rolls declining by more than -19%, the mix implies Lavish is concentrating volume in Pre-Rolls but will need flagship Flower to carry growth into late 2026.
Top Selling Cannabis Brands






Data for this report comes from real-time sales reporting by participating cannabis retailers via their point-of-sale systems, which are linked up with Headset’s business intelligence software. Headset’s data is very reliable, as it comes digitally direct from our partner retailers. However, the potential does exist for misreporting in the instance of duplicates, incorrectly classified products, inaccurate entry of products into point-of-sale systems, or even simple human error at the point of purchase. Thus, there is a slight margin of error to consider. Brands listed on this page are ranked in the top twenty within the market and product category by total retail sales volume.

