.svg)
Aug-2026
Sales
Trend
6-Month
Product Count
SKUs
Avg Price
YoY Sales Change
YoY Price Change


Where to Buy
Raging Goat is stocked at 53 licensed dispensaries across Washington, with the deepest coverage in Seattle, Mount Vernon, Spokane, Bellingham, and Lynnwood. Search by ZIP code or city below to find the closest one, or filter by product type if you are after a specific format.
Market Insights Snapshot
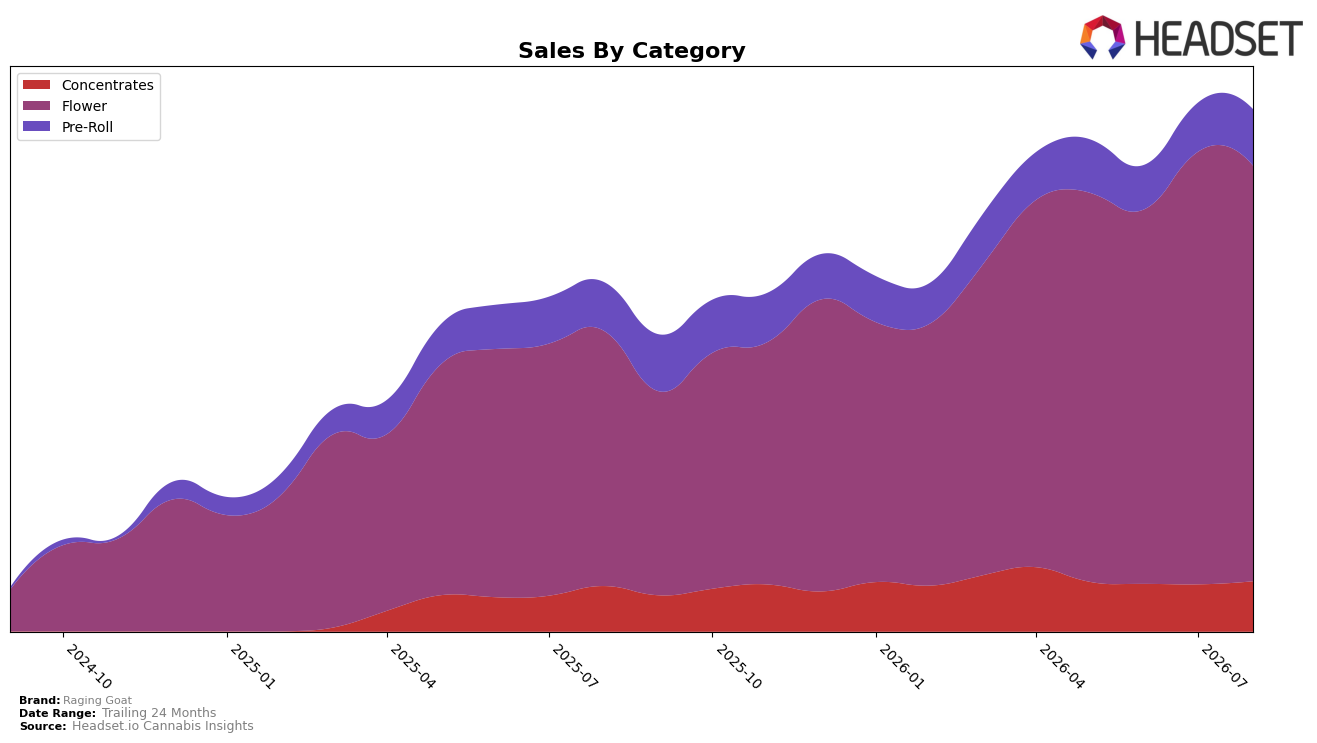
Raging Goat concentrated 79.62% of August 2026 sales in Flower, with Flower up 62.94% year over year but down 3.93% month over month, while Pre-Roll rose to 10.76% share with 15.91% YoY growth and 14.97% MoM growth; Concentrates held 9.62% share with 10.63% YoY and 6.59% MoM gains. Overall brand sales advanced 49.60% YoY as average price fell 7.19% YoY, and Flower rank in Washington stood at 46; the mix indicates MoM momentum shifting from Flower toward Pre-Roll and Concentrates even as Flower still anchors scale.
The mix shift implies Raging Goat is trading breadth for resilience: a 3.93% MoM decline in its 79.62% Flower base alongside double‑digit MoM gains in Pre-Roll (14.97%) and single‑digit MoM gains in Concentrates (6.59%) suggests a hedge against Flower volatility, aided by a 7.19% YoY price decrease that likely expanded unit throughput. With a Flower rank of 46 in Washington and Pre-Roll and Concentrates together at 20.38% share, the pattern points to a positioning that prioritizes accessible price tiers to defend share while cultivating secondary categories to stabilize month-to-month performance.
Competitive Landscape
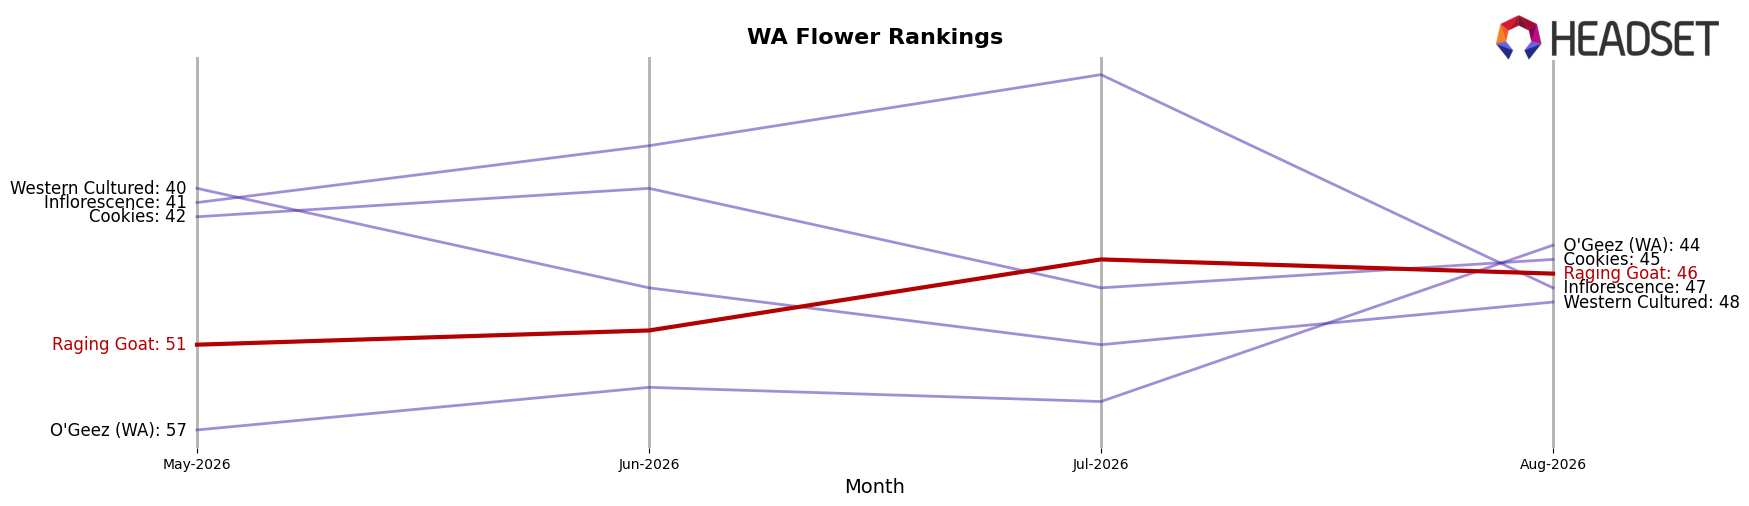
Raging Goat is ranked #46 in August 2026 in WA Flower, improving 34 places from #80 year over year, and edging up 5 spots from #51 in May 2026 while sitting just one position off its peak at #45 in July 2026; by contrast, Phat Panda held #1 both year over year and in August 2026 with a 23.7% YoY sales increase, and Lifted Cannabis Co climbed from #8 to #4 alongside a 10.8% YoY gain. The gap to leaders remains clear as Legends maintained #2 despite a 10.5% YoY sales decline and EZ Flower / EZ Puff / EZ-Joint slid from #3 to #5 with a 17.7% YoY drop, indicating that Raging Goat’s rank trajectory—up 34 positions YoY and nearing a new high—signals momentum built on relative share capture from mid-tier rivals rather than displacement of the top tier.
Notable Products
OG Kush (3.5g) posted the steepest decline at -28.0% month over month and slid to rank 8, while 9lb Hammer (3.5g) fell -25.7% to rank 6, signaling pressure on legacy Flower formats. In contrast, Super Lemon Haze Pre-Roll (1g) climbed 33.2% to rank 1 and 9 Pound Hammer Pre-Roll (1g) rose 35.9% to rank 3, and five of the top ten are Pre-Roll SKUs, indicating a demand shift toward ready-to-use formats. Strawberry Cough (3.5g) also contracted -23.3% at rank 5 as Strawberry Cough Pre-Roll (1g) was essentially flat at +0.5% at rank 2, pointing to substitution from Flower to Pre-Roll within the same strains. Together, the rank ascents in Pre-Rolls alongside double-digit Flower declines imply Raging Goat is tilting toward faster-turn, lower-pack-size products where strain familiarity can be monetized without the bulk of 3.5g units.
Top Selling Cannabis Brands






Data for this report comes from real-time sales reporting by participating cannabis retailers via their point-of-sale systems, which are linked up with Headset’s business intelligence software. Headset’s data is very reliable, as it comes digitally direct from our partner retailers. However, the potential does exist for misreporting in the instance of duplicates, incorrectly classified products, inaccurate entry of products into point-of-sale systems, or even simple human error at the point of purchase. Thus, there is a slight margin of error to consider. Brands listed on this page are ranked in the top twenty within the market and product category by total retail sales volume.

