.svg)
Aug-2026
Sales
Trend
6-Month
Product Count
SKUs
Avg Price
YoY Sales Change
YoY Price Change


Where to Buy
Native Nations Cannabis is stocked at 20 licensed dispensaries across New York, with the deepest coverage in Depew, Albany, Niagara Falls, Queens, and The Bronx. Search by ZIP code or city below to find the closest one, or filter by product type if you are after a specific format.
Market Insights Snapshot
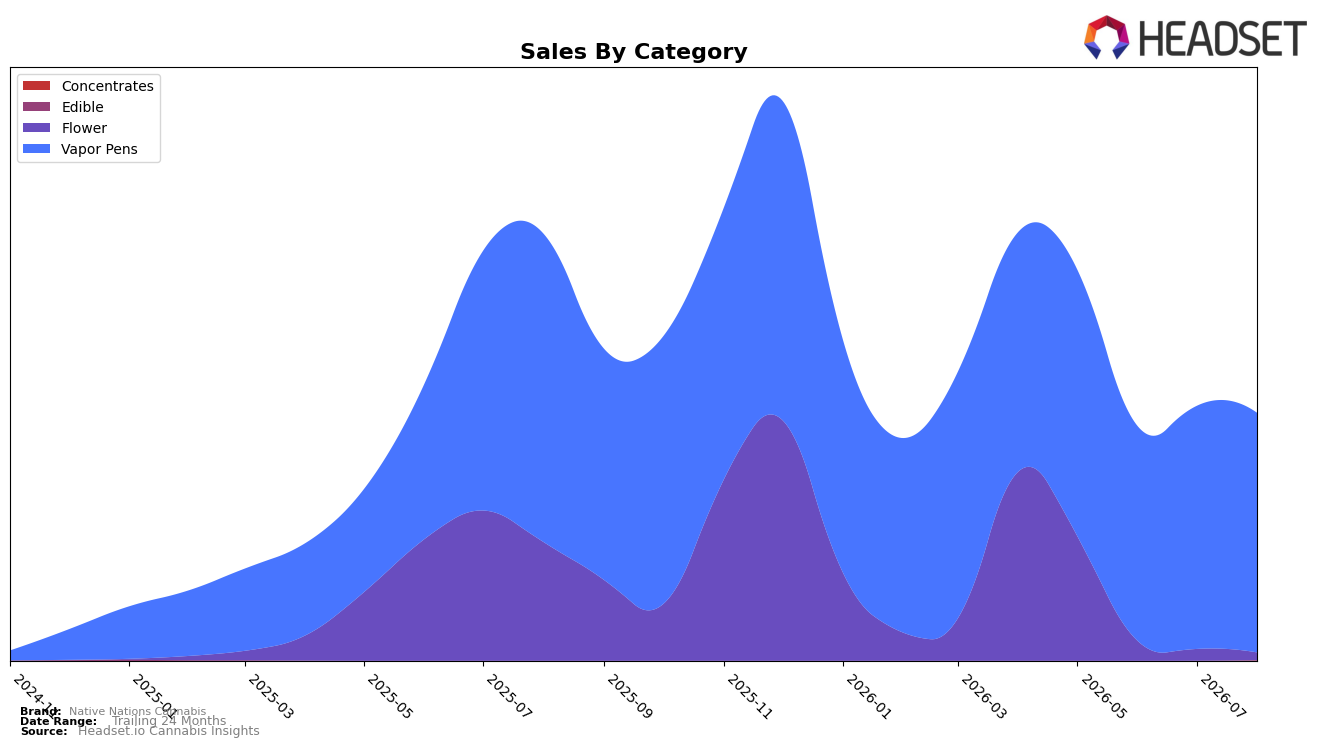
Native Nations Cannabis concentrated 96.74% of August 2026 sales in Vapor Pens, where sales fell 22.32% year over year and 1.47% month over month, while the brand’s overall sales declined 42.00% YoY and average price decreased 10.77% YoY. Flower shrank to 3.03% share with a 93.68% YoY drop and a 34.81% MoM decline, and Concentrates reached only 0.23% share despite a 544.82% MoM jump from a low base; in New York Vapor Pens the brand held rank 47. The pattern implies overexposure to a single category where rank 47 and double‑digit YoY contraction limit volume capture, while fragmentation of minor categories offers little offset despite extreme MoM volatility.
With 96.74% of mix tied to Vapor Pens and rank 47 in New York, the 22.32% YoY and 1.47% MoM declines signal a positioning anchored in a crowded mid‑tier that is vulnerable to price‑led share shifts as the brand’s average price fell 10.77% YoY. The 93.68% YoY collapse in Flower to 3.03% share and the 544.82% MoM spike in Concentrates at 0.23% share indicate tactical rather than strategic presence outside Vapor Pens; the implication is a need to either consolidate around a defensible Vapor Pens subsegment or rebalance into categories where small share gains can move total performance more than rank 47 allows today.
Competitive Landscape
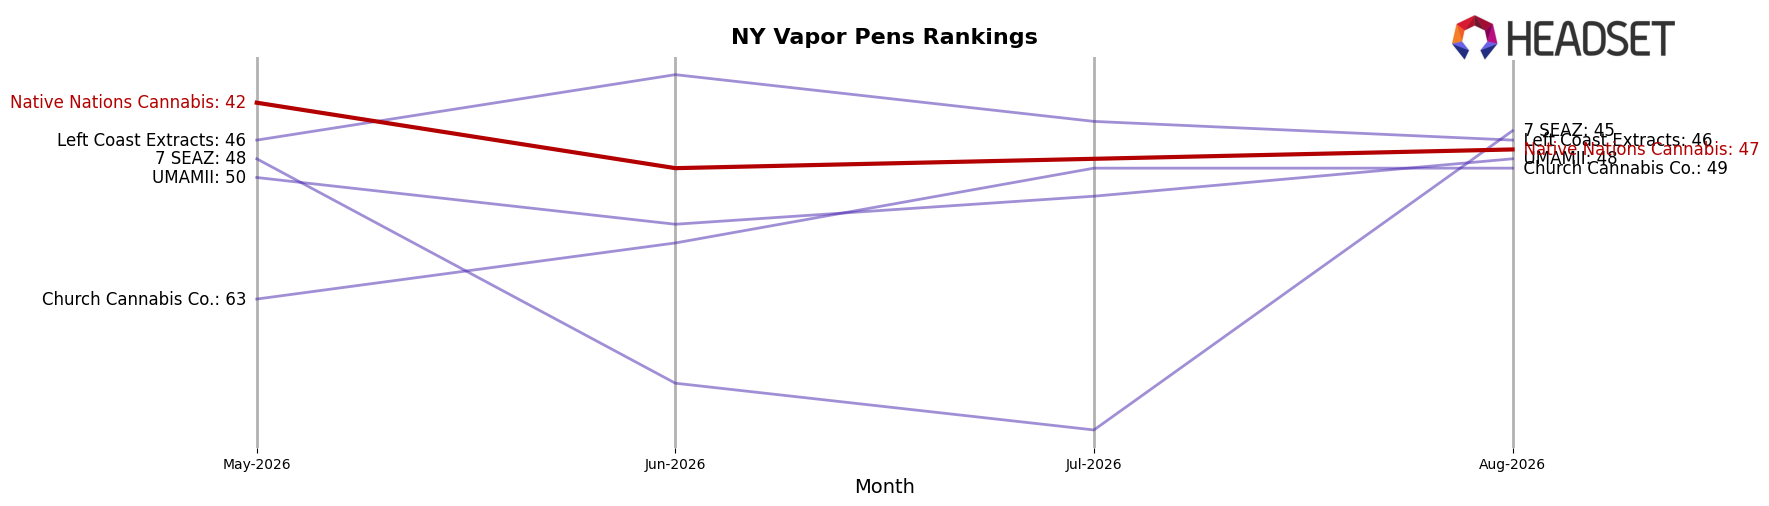
Native Nations Cannabis ranks #47 in NY Vapor Pens in August 2026, down 10 positions year over year from #37 and slipping 5 spots versus May 2026 from #42, while the brand’s peak rank of #37 in August 2025 underscores a 10-place retreat over twelve months; in contrast, Fernway advanced from #3 to #1 with 36.3% year-over-year sales growth and Jetty Extracts jumped from #26 to #5 alongside a 230.1% sales increase, indicating that Native Nations Cannabis is losing relative share as faster-rising competitors consolidate top-tier positions.
Notable Products
Alien OG Live Resin Cartridge (1g) posted the steepest decline at -22.1% and slid to rank 2, while Rainbow Z Live Resin Disposable (0.5g) fell -25.8% at rank 10, signaling volatility at the edges of the lineup. In contrast, Super Lemon Haze Live Resin Cartridge (1g) rose +126.4% to rank 1 with $24,169, and Grand Daddy Purple Live Resin Cartridge (1g) advanced +12.5% at rank 3, indicating momentum is concentrated in cartridges while disposables are contracting. With all top-10 entries in Vapor Pens and six of the top six being 1g live resin cartridges, the assortment points to a pivot toward higher-capacity cartridges as the commercial core for Native Nations Cannabis.
Top Selling Cannabis Brands






Data for this report comes from real-time sales reporting by participating cannabis retailers via their point-of-sale systems, which are linked up with Headset’s business intelligence software. Headset’s data is very reliable, as it comes digitally direct from our partner retailers. However, the potential does exist for misreporting in the instance of duplicates, incorrectly classified products, inaccurate entry of products into point-of-sale systems, or even simple human error at the point of purchase. Thus, there is a slight margin of error to consider. Brands listed on this page are ranked in the top twenty within the market and product category by total retail sales volume.

