.svg)

Jul-2026
Sales
Trend
6-Month
Product Count
SKUs
Avg Price
YoY Sales Change
YoY Price Change


Where to Buy
No Bad Days (MI) is stocked at 40 licensed dispensaries across New York, with the deepest coverage in New York, Queens, Buffalo, Depew, and Farmingdale. Search by ZIP code or city below to find the closest one, or filter by product type if you are after a specific format.
Market Insights Snapshot
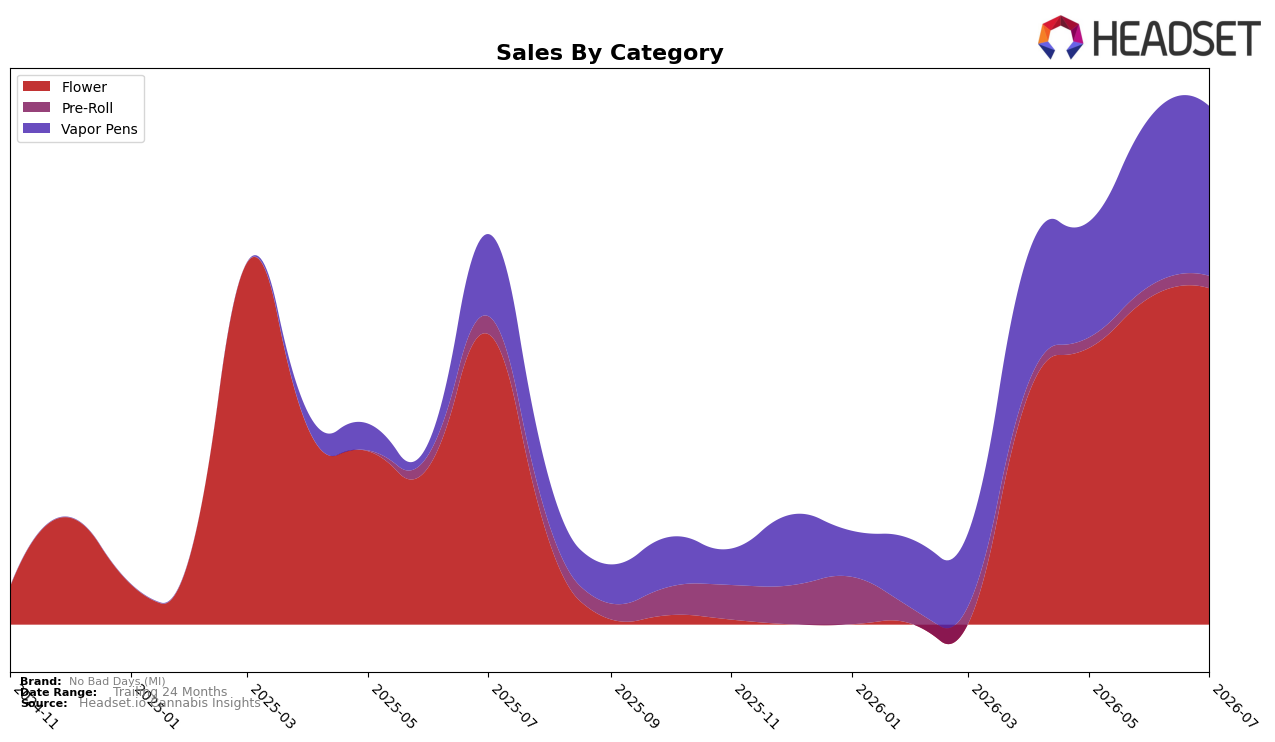
No Bad Days (MI) concentrated 64.9% of July 2026 sales in Flower while Vapor Pens accounted for 32.8% and Pre-Roll 2.3%, with Flower up 15.8% year over year and 2.8% month over month and Vapor Pens up 107.6% year over year and 0.8% month over month. Despite Pre-Roll growing 7.9% month over month, its year-over-year decline of 31.5% signals a de-prioritized segment as the portfolio tilts toward higher-velocity formats; taken together with the brand’s 32.9% overall sales growth and a rank of 39 in Flower in New York, the pattern implies a two-engine mix where Vapor Pens drive incremental gains while Flower remains the scale anchor.
The mix shift—Vapor Pens comping triple digits year over year at 107.6% alongside Flower’s steadier 15.8%—implies the brand is migrating from a single-category identity toward a dual-pillar positioning, with July 2026 momentum favoring penetration plays in Vapor Pens rather than pure share defense in Flower. With Pre-Roll holding only 2.3% share despite a 7.9% month-over-month uptick and Flower ranking 39th in New York, the brand’s opportunity lies in leveraging the faster Vapor Pens growth to elevate overall rank while using Flower’s 2.8% month-over-month lift to stabilize base volume, implying pricing and assortment decisions should prioritize Vapor Pens expansion without eroding Flower’s scale.
Competitive Landscape
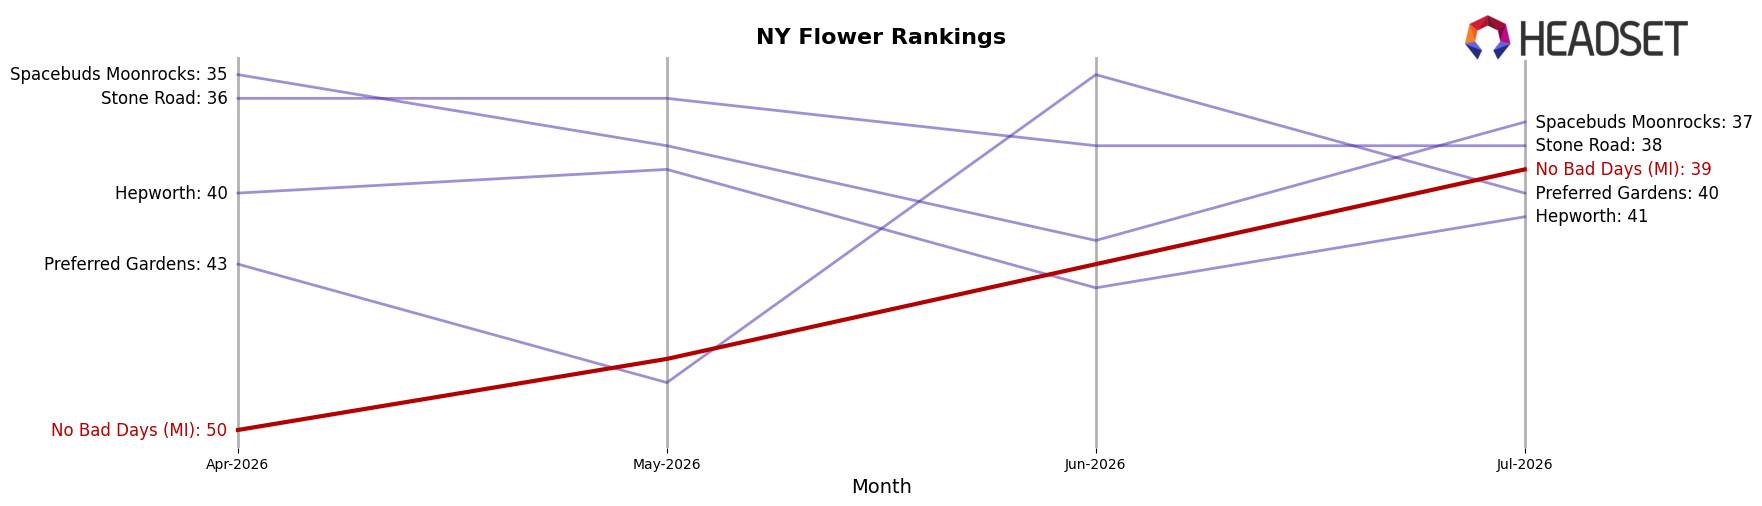
No Bad Days (MI) sits at rank #39 in New York Flower for July 2026, reaching its peak rank of #39 this month while improving 11 positions from #50 in April 2026; the absence of a year-over-year rank benchmark contrasts with competitor momentum where Find. moved to #1 with an 8-place YoY climb and 46.7% YoY sales growth, and Grassroots advanced to #5 with a 15-place YoY jump and 79.8% YoY sales growth. Compared with Dank. By Definition, which is #3 despite a 51.5% YoY sales decline and only a 1-rank YoY gain, No Bad Days (MI)’s 3-month rank rise suggests recent distribution or velocity gains outpacing its own historical baseline, implying a window to convert short-term rank momentum into sustained mid-tier placement if July 2026 performance can be stabilized against top-five competitors’ double-digit YoY growth.
Notable Products
Bubble Biscotti Infused Pre-Roll (1.2g) posted the standout move in July 2026 with a 91% month-over-month surge and a jump into rank 2, while Granddaddy Purple (28g) slipped 9% to rank 3. Vapor Pens placed three SKUs in the top ten with Blue Dream Distillate Cartridge (1g) up 35% at rank 5 and Cake Badder Distillate Cartridge (1g) up 38% at rank 10, signaling momentum outside bulk Flower even as Chem Pineapples Distillate Cartridge (1g) was flat at -0.3% in rank 8. Within Flower, OG Kush (28g) rose 31% to rank 6 and Green Crack (28g) climbed 45% to rank 7, offsetting the Granddaddy Purple decline and balancing category exposure. The pattern implies No Bad Days (MI) is tilting from reliance on a single Flower anchor toward a mixed portfolio where Infused Pre-Rolls and select Vapor Pens drive incremental rank gains.
Top Selling Cannabis Brands






Data for this report comes from real-time sales reporting by participating cannabis retailers via their point-of-sale systems, which are linked up with Headset’s business intelligence software. Headset’s data is very reliable, as it comes digitally direct from our partner retailers. However, the potential does exist for misreporting in the instance of duplicates, incorrectly classified products, inaccurate entry of products into point-of-sale systems, or even simple human error at the point of purchase. Thus, there is a slight margin of error to consider. Brands listed on this page are ranked in the top twenty within the market and product category by total retail sales volume.

