.svg)

Aug-2026
Sales
Trend
6-Month
Product Count
SKUs
Avg Price
YoY Sales Change
YoY Price Change


Market Insights Snapshot
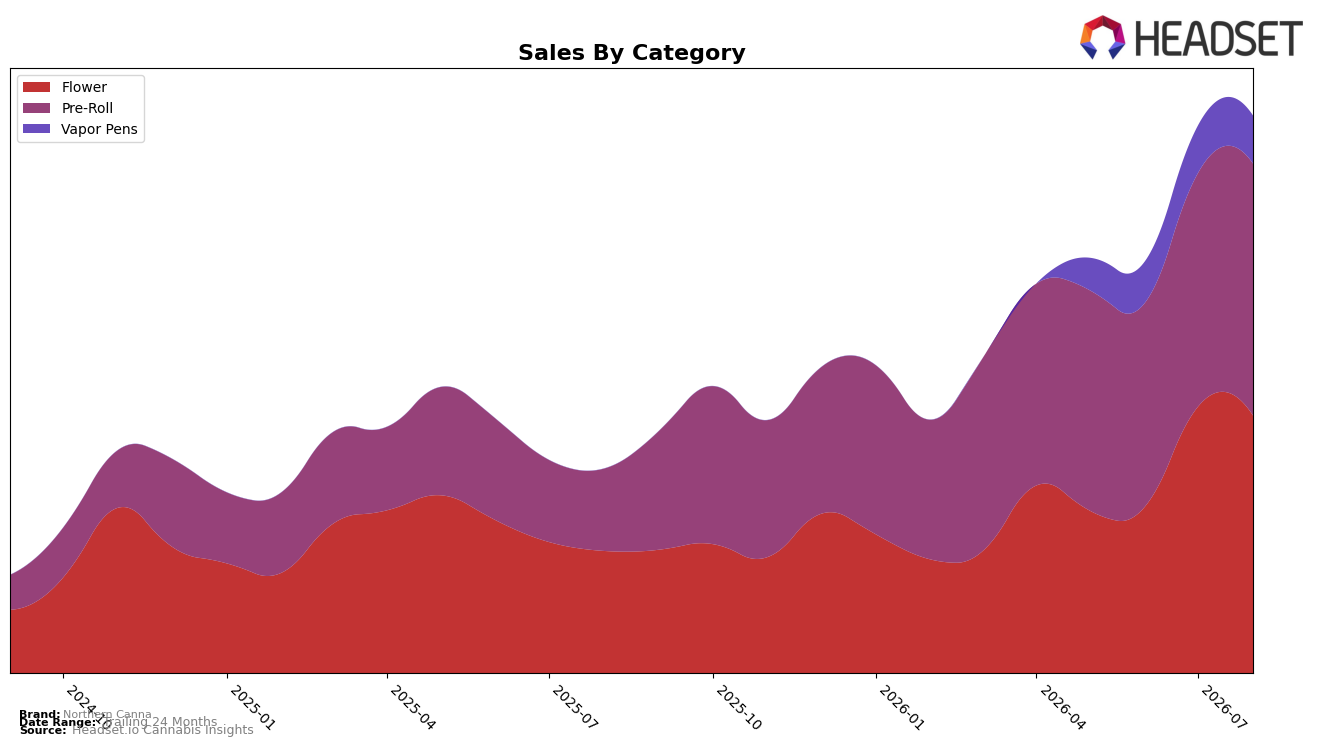
Northern Canna concentrated 91.41% of August 2026 sales in Flower (46.17% share, -3.71% MoM, +110.33% YoY) and Pre-Roll (45.24% share, +7.79% MoM, +206.53% YoY), with Vapor Pens at 8.59% share and +0.89% MoM (no YoY baseline). Average price rose 2.21% YoY to $34.77 while Flower priced at $49.25 and Vapor Pens at $44.07, indicating a mix shift toward lower-priced Pre-Rolls despite brand-level YoY sales up 172.42%. The concentration in two inhalable formats coupled with divergent MoM trends implies a near-term pivot toward Pre-Roll momentum within Ontario, while Flower stability anchors velocity but concedes marginal share.
With Flower ranked 45 in Ontario during August 2026 and Pre-Roll expanding faster (+7.79% MoM vs. Flower -3.71% MoM), the portfolio tilts toward value-accessible, higher-churn units that can lift distribution but may dilute premium positioning set by higher Flower pricing. The surge of Pre-Roll at +206.53% YoY alongside overall brand sales +172.42% YoY suggests gains are increasingly driven by convenience-oriented formats, implying competitive differentiation should emphasize pack architecture and repeatability while protecting Flower trade-up to avoid compressing realized price.
Competitive Landscape
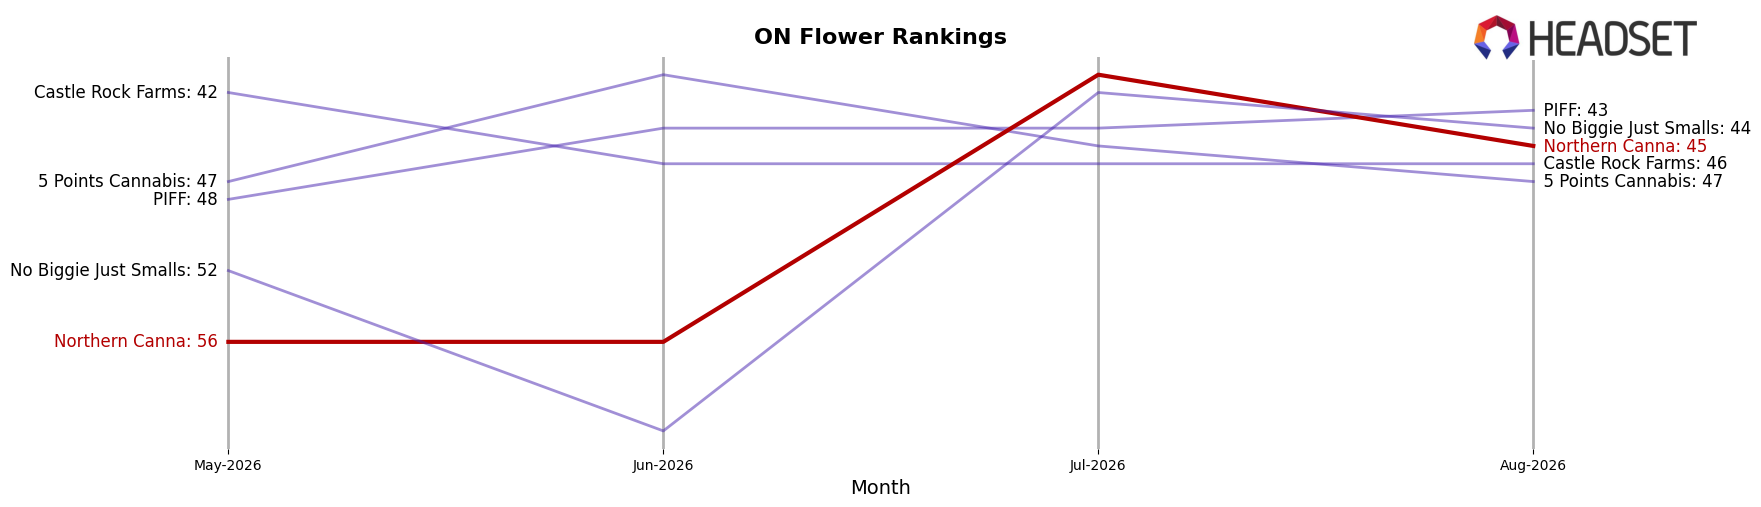
Northern Canna sits at rank #45 in ON Flower in August 2026, improving 21 positions from #66 year over year and 11 positions from #56 three months prior, while its peak of #41 in July 2026 places it 4 spots above the current level; meanwhile, Shred advanced from #2 to #1 with 18.96% YoY sales growth and Spinach climbed from #4 to #2 with 27.45% YoY growth, indicating Northern Canna’s mid-pack rise is occurring as top-tier leaders also pull ahead. The directional gap is further framed by Back Forty / Back 40 Cannabis holding at #3 year over year while Big Bag O' Buds slipped from #1 to #4 despite 1.46% YoY growth, and The Original Fraser Valley Weed Co. eased from #6 to #5 with a -17.49% YoY decline, implying Northern Canna’s rank trajectory reflects incremental share capture against weakening mid-tier rivals but not yet enough to close distance with accelerating leaders.
Notable Products
Frosted Guava Nuts (3.5g) posted the largest movement in August 2026 with a +53.6% month-over-month surge, climbing to rank 2, while Frosted Tiger Nuts Pre-Roll 3-Pack (1.5g) fell -26.7% to rank 5. Permanent Marker Pre-Roll 3-Pack (1.5g) held rank 1 with +25.6% MoM, and The Collective Pre-Roll 10-Pack (5g) slid -37.7% to rank 10. With seven of the top ten in Pre-Roll, the mix points to a portfolio skew where value and pack-size variability in Pre-Rolls drive traffic, while Flower spikes anchor basket trade-ups.
Top Selling Cannabis Brands






Data for this report comes from real-time sales reporting by participating cannabis retailers via their point-of-sale systems, which are linked up with Headset’s business intelligence software. Headset’s data is very reliable, as it comes digitally direct from our partner retailers. However, the potential does exist for misreporting in the instance of duplicates, incorrectly classified products, inaccurate entry of products into point-of-sale systems, or even simple human error at the point of purchase. Thus, there is a slight margin of error to consider. Brands listed on this page are ranked in the top twenty within the market and product category by total retail sales volume.

