.svg)


Market Insights Snapshot
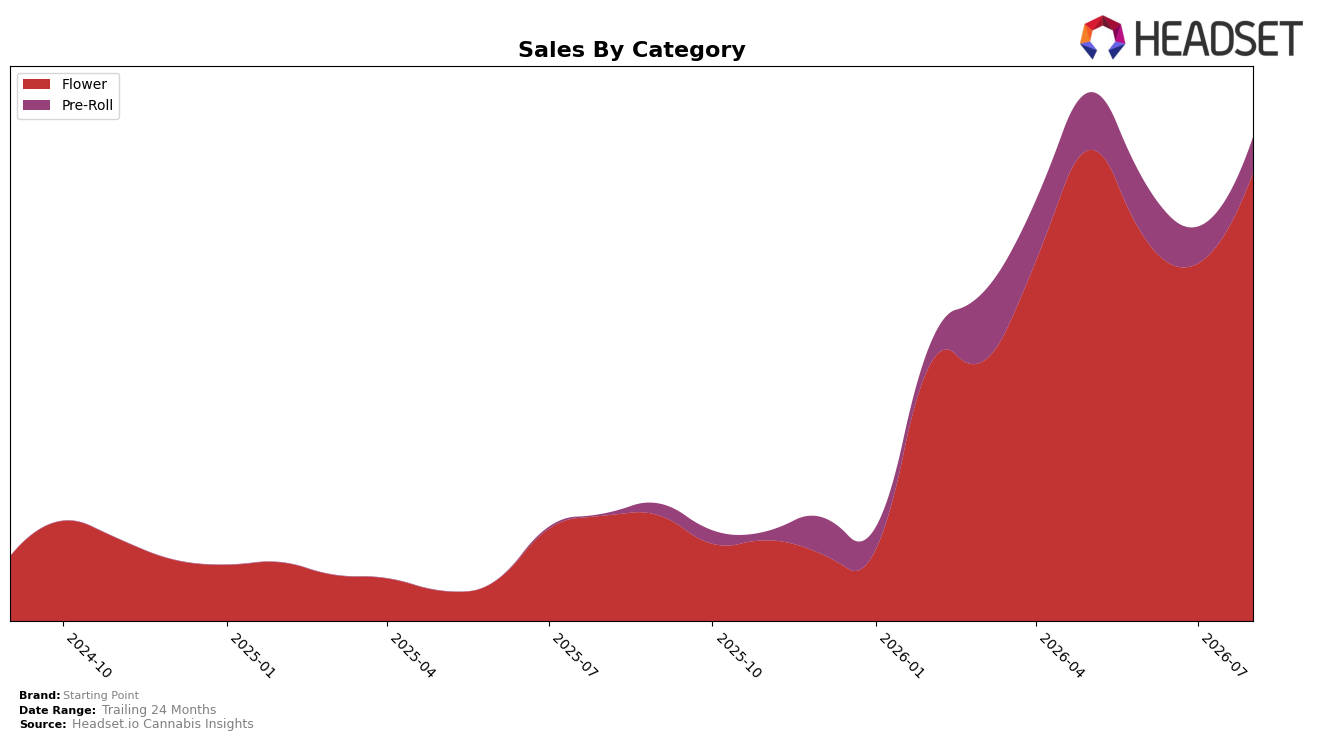
Starting Point concentrated 92.67% share in Flower with 7.33% in Pre-Roll, while Flower rose 326.66% year over year and 25.42% month over month in August 2026, compared to Pre-Roll surging 1905.33% year over year but slipping 3.03% month over month. Average price increased 41.93% year over year to $72.96 as Flower averaged $78.08 and Pre-Roll $39.89, indicating mix-upward pressure even as Pre-Roll’s MoM contraction limited price-led expansion. With Flower anchoring scale and Pre-Roll acting as a volatile tail, the pattern implies category leadership relies on sustaining Flower’s momentum while selectively managing Pre-Roll volatility to protect margin trajectory.
Holding rank 44 in Flower in Alberta alongside a 92.67% Flower mix positions Starting Point as a scale player in a crowded middle tier, and the 25.42% month-over-month Flower growth suggests near-term share capture potential if maintained. However, the 3.03% month-over-month decline in Pre-Roll against a 1905.33% year-over-year jump signals trial-heavy, less sticky demand, and the 41.93% year-over-year price increase paired with a $78.08 Flower average indicates reliance on premium price bands that could cap velocity if competitive pricing tightens. The implication is to consolidate Flower-driven rank gains while rebalancing Pre-Roll toward steadier SKUs to stabilize monthly swings and convert trial into repeat, strengthening positioning without diluting the premium price architecture.
Competitive Landscape
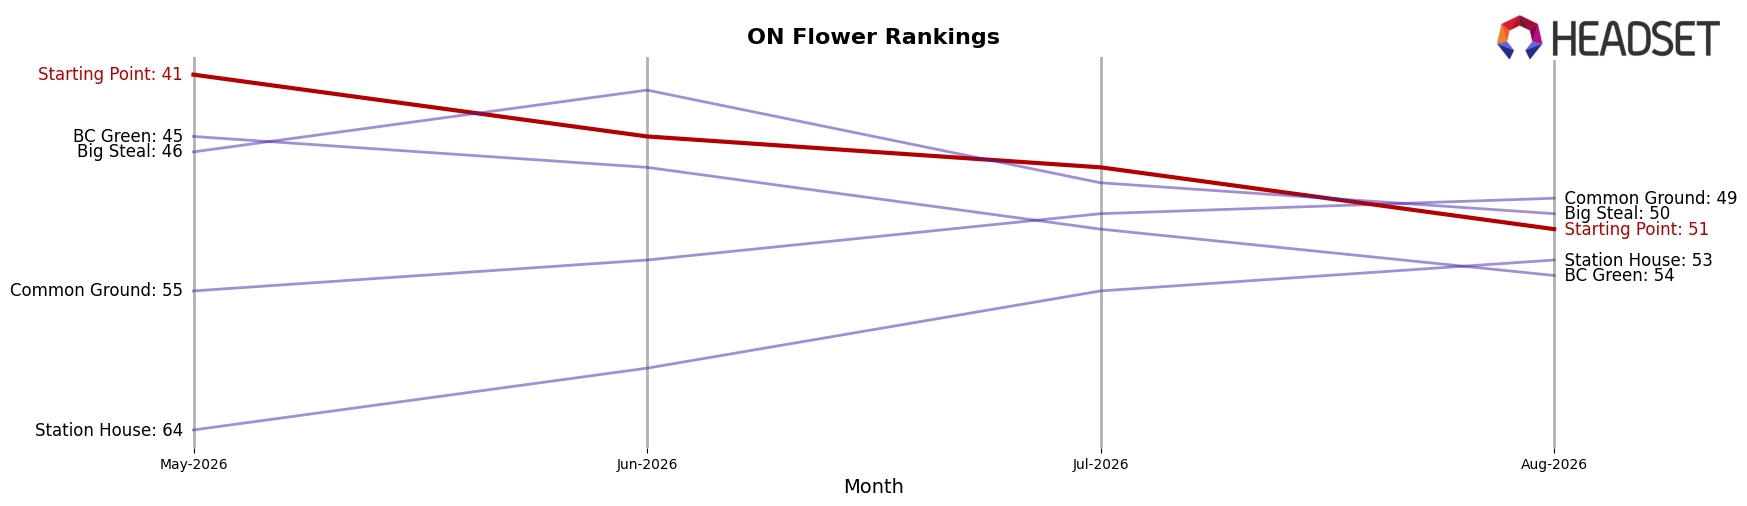
Starting Point sits at rank #51 in August 2026, improving 40 positions year over year from #91, yet sliding 10 spots since May 2026 when it peaked at #41; this mix of a +40 YoY climb and a -10 three-month drop indicates momentum that cooled entering late summer. In contrast, Shred holds #1 after rising from #2 with 18.96% YoY sales growth, while Spinach advanced from #4 to #2 with 27.45% YoY growth; against that backdrop, Starting Point’s move from #91 to #51 alongside a fall from #41 to #51 implies share gains versus the broader field but insufficient recent velocity to keep pace with the category leaders.
Notable Products
Moon Drifter (28g) posted the standout move in August 2026 with a 74.4% month-over-month surge to rank 3, while Star Chase Pre-Roll 10-Pack (3.5g) fell 60.6% and slid to rank 8, indicating demand is consolidating in larger Flower formats over smaller Pre-Roll packs. Star Chase (28g) also advanced 23.5% at rank 1 versus Frenchy Macaroni (28g) up 53.5% at rank 7, and four of the top ten are Flower SKUs, pointing to a product mix pivot toward high-quantity Flower that can absorb price-sensitive shifts better than multi-pack Pre-Rolls.
Top Selling Cannabis Brands






Data for this report comes from real-time sales reporting by participating cannabis retailers via their point-of-sale systems, which are linked up with Headset’s business intelligence software. Headset’s data is very reliable, as it comes digitally direct from our partner retailers. However, the potential does exist for misreporting in the instance of duplicates, incorrectly classified products, inaccurate entry of products into point-of-sale systems, or even simple human error at the point of purchase. Thus, there is a slight margin of error to consider. Brands listed on this page are ranked in the top twenty within the market and product category by total retail sales volume.

