.svg)



Market Insights Snapshot
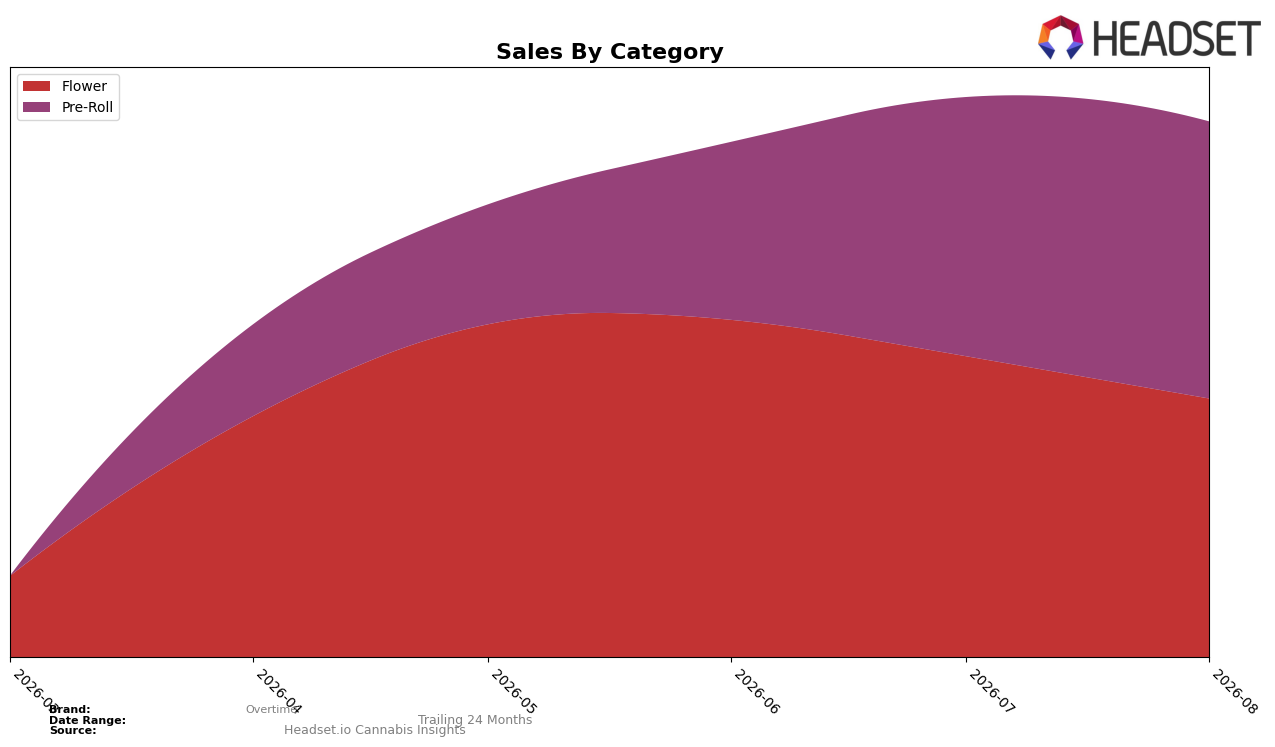
Overtime split its August 2026 revenue between Pre-Roll at 51.46% share and Flower at 48.54% share, with Pre-Roll rising 5.90% month over month while Flower fell 12.22% month over month. Average prices diverged materially, with Pre-Roll at $7.19 versus Flower at $25.54, and Pre-Roll reached a rank of 46 in the Pre-Roll category in Ontario. The pattern implies an ongoing tilt toward lower-priced, ready-to-use products and a relative step back in packaged bud, positioning the brand to accumulate volume where price elasticity is tighter and to cede some momentum where ticket sizes are higher.
The simultaneous 5.90% Pre-Roll expansion and 12.22% Flower contraction in August 2026, combined with a 51.46% mix weight in Pre-Roll and a rank of 46 in Ontario Pre-Rolls, concentrates Overtime in a segment where smaller basket adds can scale quickly but face dense shelf competition. With a $7.19 Pre-Roll price versus $25.54 in Flower and a 2.93 percentage-point mix gap favoring Pre-Roll, the near-term positioning favors velocity over premium margin capture, implying the brand should prioritize format breadth and pack architecture in Pre-Rolls while selectively defending Flower only where price ladders can close the conversion gap.
Competitive Landscape
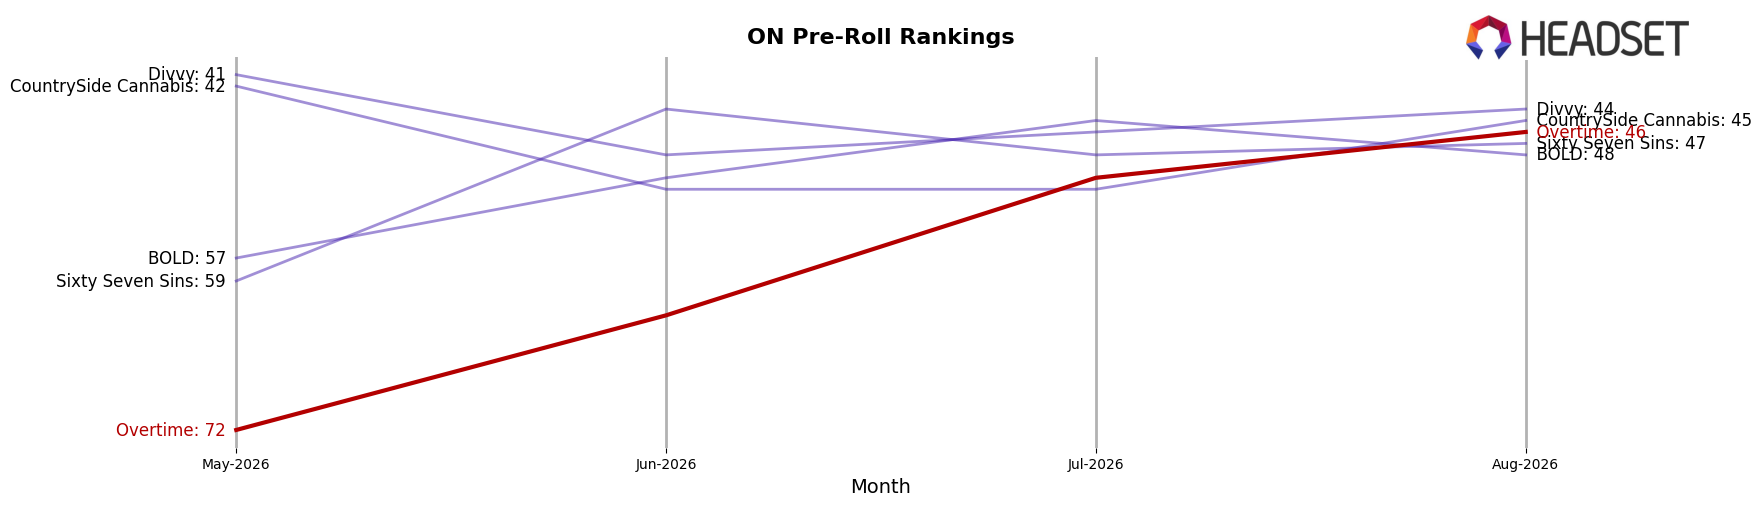
Overtime sits at #46 in ON Pre-Roll in August 2026, a climb of 26 positions from #72 in May 2026, and matching its peak rank of #46 in August 2026; with no year-ago rank available, the immediate signal is a quarter-on-quarter rise rather than a confirmed year-over-year rebound. In contrast, Back Forty / Back 40 Cannabis holds #1 with a year-over-year move from #2 to #1 and sales up 56.6%, while General Admission slipped from #1 to #2 with sales down 28.1%, indicating top-tier churn that can open mid-table slots as leaders trade places. Meanwhile, Thumbs Up Brand rose from #10 to #3 on 70.7% sales growth and Spinach jumped from #14 to #5 with 81.6% growth, outpacing Overtime’s rank momentum and signaling that faster-accelerating competitors are compressing share in the upper tiers; the net pattern implies Overtime’s trajectory is upward but depends on sustaining multi-month gains to convert a #46 peak into durable mid-pack presence.
Notable Products
Break Time Pre-Roll (0.5g) posted the sharpest move in August 2026 with a 190.8% month-over-month surge, climbing into rank 3 while Gorilla Glue #4 Pre-Roll 4-Pack (2g) fell 18.6% at rank 8. Four of the top ten are Pre-Roll SKUs, and within that group Night Shift Pre-Roll 4-Pack (2g) slid 8.2% at rank 2 as On the Clock Pre-Roll 10-Pack (3.5g) rose 13.7% at rank 10. This concentration and volatility imply a pivot toward value-oriented Pre-Roll formats driving traffic even as select legacy Pre-Roll variants soften.
Flower mixed signals are visible as Clock In (3.5g) grew 9.7% at rank 4 while Punch Out (7g) declined 14.1% at rank 6 and Payday Pack (28g) dropped 35.3% at rank 9 on approximately $84,968. With three Flower SKUs in ranks 4–9 and diverging MoM rates from +9.7% to -35.3%, Overtime is skewing away from larger sizes toward smaller, faster-turn packages in August 2026.
Top Selling Cannabis Brands






Data for this report comes from real-time sales reporting by participating cannabis retailers via their point-of-sale systems, which are linked up with Headset’s business intelligence software. Headset’s data is very reliable, as it comes digitally direct from our partner retailers. However, the potential does exist for misreporting in the instance of duplicates, incorrectly classified products, inaccurate entry of products into point-of-sale systems, or even simple human error at the point of purchase. Thus, there is a slight margin of error to consider. Brands listed on this page are ranked in the top twenty within the market and product category by total retail sales volume.

