.svg)


Market Insights Snapshot
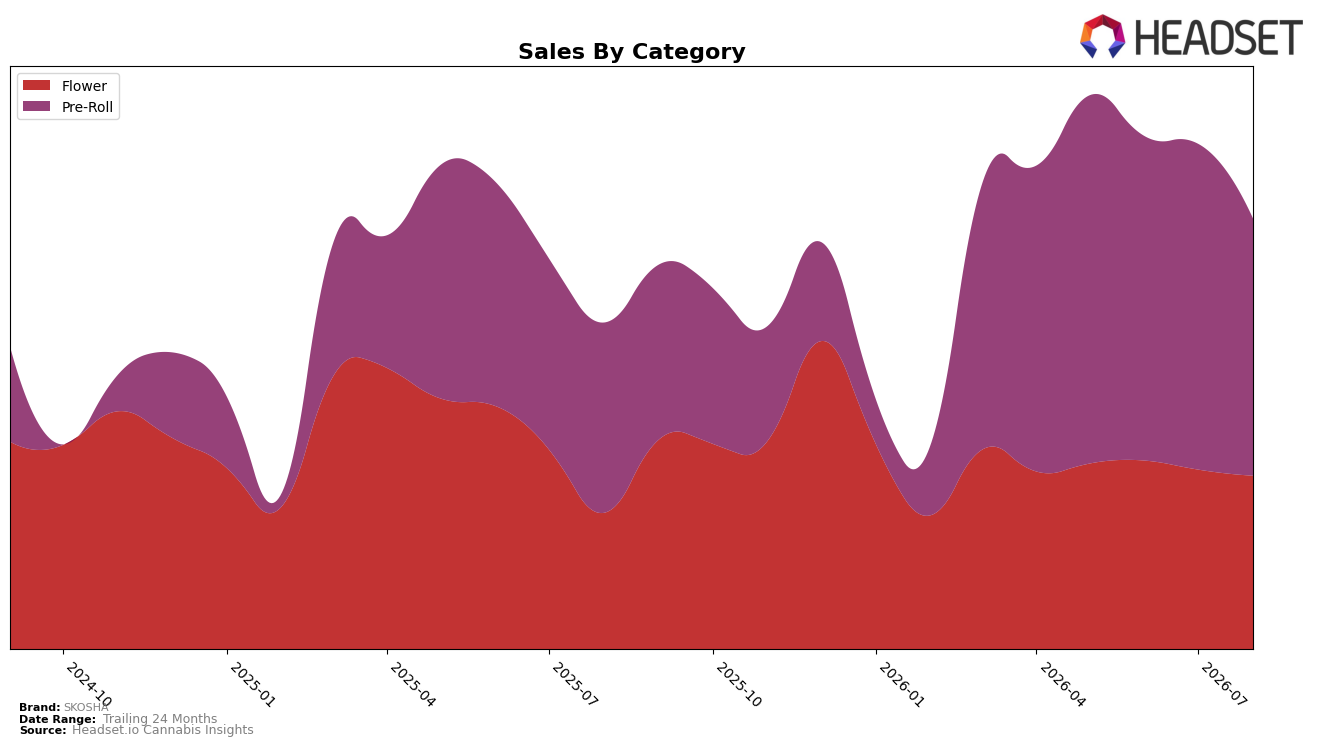
In August 2026, SKOSHA’s mix was concentrated in Pre-Roll at 53.77% share and Flower at 46.23%, with Pre-Roll up 12.61% year over year but down 10.52% month over month, while Flower rose 7.89% year over year and slipped 1.19% month over month; average price rose 25.73% year over year to $22.25. Within Flower, SKOSHA ranked 38th in Ontario, and Pre-Roll’s double-digit monthly decline versus Flower’s low-single-digit monthly dip indicates a rebalancing away from volume-led formats toward higher-priced items; the pattern implies SKOSHA is leaning into price/mix to offset soft near-term Pre-Roll velocity.
The divergence—Pre-Roll carrying 53.77% share but falling 10.52% month over month, versus Flower at 46.23% share with only a 1.19% monthly decline—alongside a 25.73% average price lift suggests a margin-first posture, where premium Flower pricing can cushion volatility in value-oriented Pre-Rolls. With Flower up 7.89% year over year and a 38th rank in Ontario Flower, the configuration points to a positioning that prioritizes price architecture and pack-size or potency mix to sustain brand sales growth of 10.38% year over year even as the largest category endures short-term pullback.
Competitive Landscape
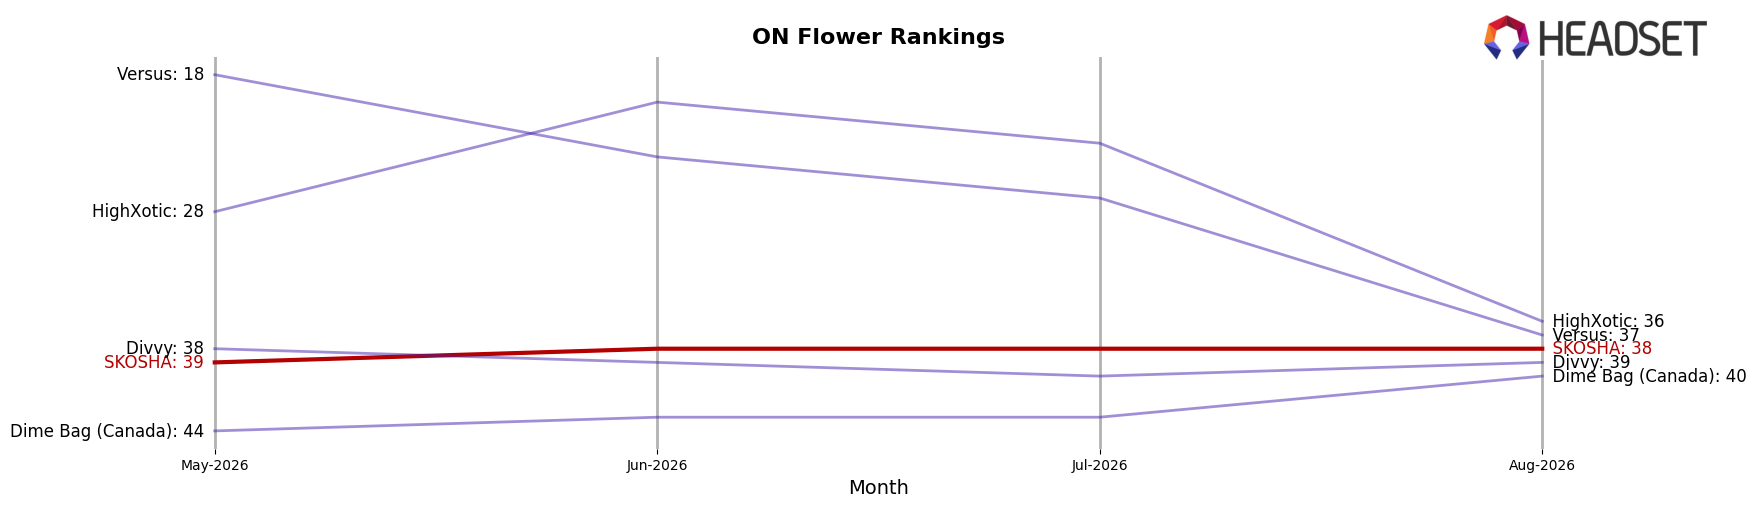
SKOSHA sits at rank #38 in Ontario Flower for August 2026, improving 2 positions from #40 year over year, but slipping 1 position from #39 in May 2026, indicating a narrow band of movement around the mid-to-lower tier; meanwhile, peak performance of #32 in September 2025 places the current #38 six spots below the brand’s best. Among competitors, Shred moved from #2 to #1 as of August 2026 with 18.96% year-over-year sales growth, while Spinach climbed from #4 to #2 on 27.45% growth, a directional gap that widens the distance between SKOSHA’s modest 2-rank YoY gain and the leaders’ multi-rank ascents; this trajectory implies SKOSHA is stabilizing rather than breaking out, and without a step-change in share capture, the brand risks getting locked into the low-30s to high-30s rank band as category pace setters extend their lead.
Notable Products
Purple Caviar (3.5g) had the steepest decline in August 2026 at -32.6% and slipped to rank 8, while Crab Cakes Pre-Roll 10-Pack (5g) fell -30.4% to rank 5, indicating mid-pack volatility that contrasts with stability at the very top. Crab Cakes (1g) dropped -18.7% to rank 3 as Crab Cakes (3.5g) inched up +3.1% to rank 2, and Crab Cakes Pre-Roll 3-Pack (1.5g) held rank 1 despite a -5.5% dip, concentrating multiple top-10 positions in the Crab Cakes family. Storm Pre-Roll 10-Pack (5g) rose +16.5% to rank 4, but overall three Pre-Roll SKUs sit in the top five while Flower spans ranks 2, 3, 6, 7, and 8, signaling an assortment where Pre-Roll leads velocity and Flower provides depth. The pattern implies SKOSHA is leaning into Pre-Roll for headline share while managing SKU rationalization risk in Flower, using the Crab Cakes franchise as the anchor for both trial and trade-up.
Top Selling Cannabis Brands






Data for this report comes from real-time sales reporting by participating cannabis retailers via their point-of-sale systems, which are linked up with Headset’s business intelligence software. Headset’s data is very reliable, as it comes digitally direct from our partner retailers. However, the potential does exist for misreporting in the instance of duplicates, incorrectly classified products, inaccurate entry of products into point-of-sale systems, or even simple human error at the point of purchase. Thus, there is a slight margin of error to consider. Brands listed on this page are ranked in the top twenty within the market and product category by total retail sales volume.

