.svg)
Aug-2026
Sales
Trend
6-Month
Product Count
SKUs
Avg Price
YoY Sales Change
YoY Price Change


Where to Buy
Nostalgia is stocked at 74 licensed dispensaries across Massachusetts, with the deepest coverage in Quincy, Chelsea, Easthampton, Springfield, and Charlton. Search by ZIP code or city below to find the closest one, or filter by product type if you are after a specific format.
Market Insights Snapshot
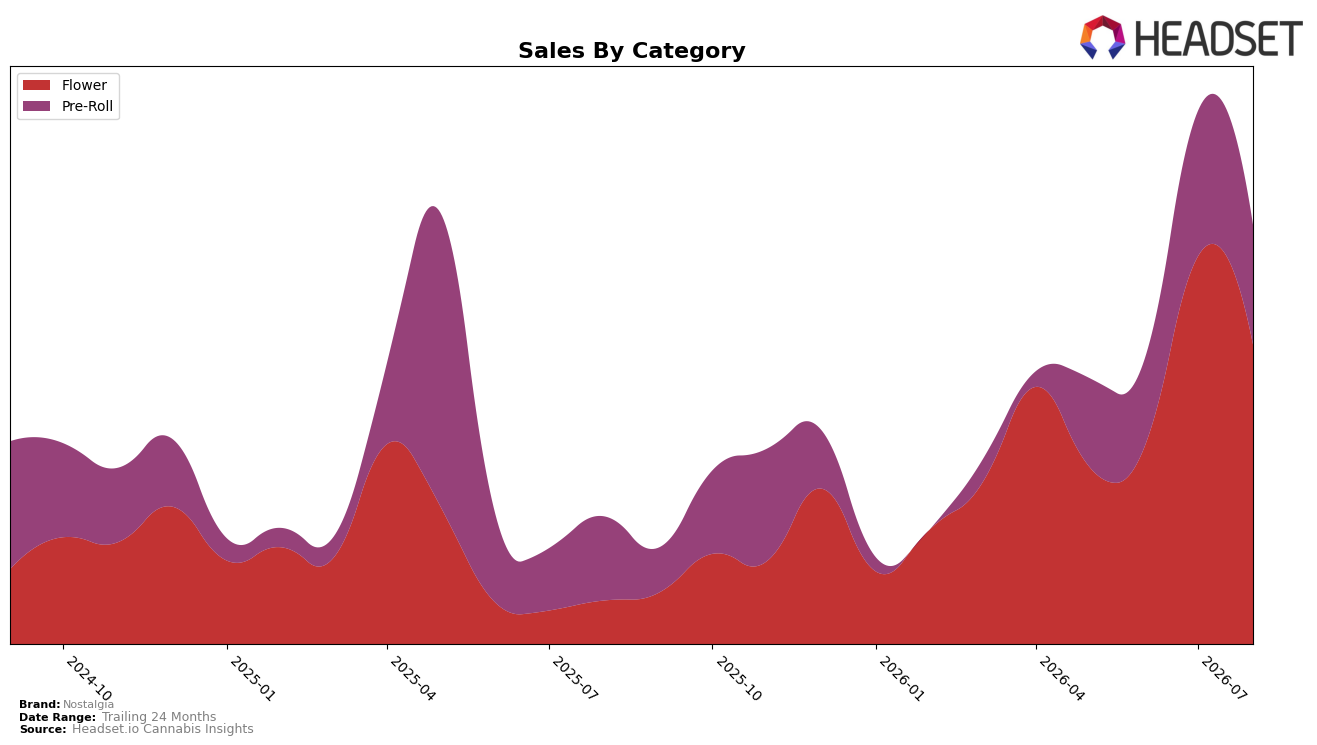
Nostalgia concentrated 65.22% of August 2026 sales in Flower with 198.44% year-over-year growth while Pre-Roll held 34.78% with 20.93% year-over-year growth, yet both categories declined month over month at -18.71% and -11.17% respectively. Average price rose 29.09% year over year to $19.80, while Flower’s dominance coincided with a rank of 36 in Flower within Massachusetts, implying the brand is over-indexing in a volatile primary category even as overall brand sales expanded 97.58% year over year.
The pivot toward high-growth Flower (198.44% YoY) alongside a simultaneous monthly pullback (-18.71% MoM) suggests demand is elastic to price and promotion, while Pre-Roll’s smaller YoY lift (20.93%) and softer MoM (-11.17%) indicate a secondary role that may buffer but not offset Flower swings. Given a 36th rank in Flower and a 65.22% mix concentration, the pattern implies Nostalgia’s positioning is leverageable through deeper penetration and price-pack architecture in Flower to stabilize monthly volatility and lift rank without diluting the 34.78% Pre-Roll base.
Competitive Landscape
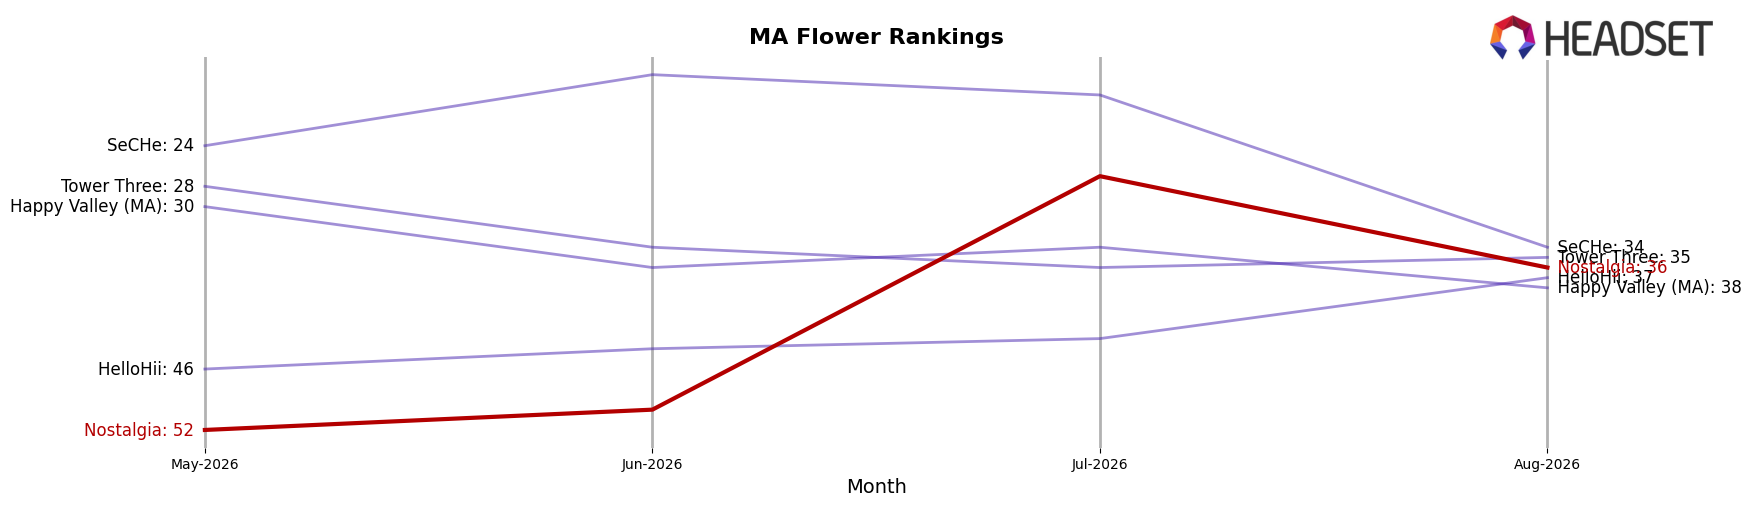
Nostalgia sits at rank 36 in August 2026 in MA Flower, improving 44 positions year over year from rank 80, and advancing 16 spots from rank 52 in May 2026 while peaking at rank 27 in July 2026; this contrasts with Perpetual Harvest holding rank 1 after climbing from rank 4 year over year and Root & Bloom moving to rank 5 from rank 9 with 50.5% YoY sales growth. Against top-tier stability where Farmer's Cut holds rank 2 from rank 2 and Simply Herb sits at rank 3 from rank 1 with a 6.2% YoY sales decline, Nostalgia’s mid-summer peak and subsequent position suggest momentum is improving but not yet durable enough to sustain a top-30 foothold.
Notable Products
Blue Dream Pre-Roll (1g) posted the steepest decline at -35.37% while falling to rank 4, and Panama Red Pre-Roll (1g) slid -18.50% at rank 2, indicating demand is rotating within the top tier rather than expanding broadly. In contrast, Maui Waui Pre-Roll (1g) climbed +33.63% to rank 1 and Granddaddy Purple Pre-Roll (1g) rose +34.33% at rank 3, creating a split where half of the top four gained over +30% as three SKUs from ranks 4–7 contracted between -35.37% and -41.58%. Eight of the top ten are Pre-Roll SKUs, concentrating mix risk in a single category even as one new entrant, Blueberry Pre-Roll (1g), debuts at rank 5 with $13,492.
The pattern implies Nostalgia is consolidating into a few momentum Pre-Rolls while ceding volume in legacy names, suggesting short-term share will hinge on quickly swapping shelf space toward the two rising SKUs and pruning underperformers.
Top Selling Cannabis Brands






Data for this report comes from real-time sales reporting by participating cannabis retailers via their point-of-sale systems, which are linked up with Headset’s business intelligence software. Headset’s data is very reliable, as it comes digitally direct from our partner retailers. However, the potential does exist for misreporting in the instance of duplicates, incorrectly classified products, inaccurate entry of products into point-of-sale systems, or even simple human error at the point of purchase. Thus, there is a slight margin of error to consider. Brands listed on this page are ranked in the top twenty within the market and product category by total retail sales volume.

