.svg)

Aug-2026
Sales
Trend
6-Month
Product Count
SKUs
Avg Price
YoY Sales Change
YoY Price Change


Where to Buy
Twisted Buds is stocked at 41 licensed dispensaries across Massachusetts, with the deepest coverage in Boston, Taunton, Abington, Brockton, and Fall River. Search by ZIP code or city below to find the closest one, or filter by product type if you are after a specific format.
Market Insights Snapshot
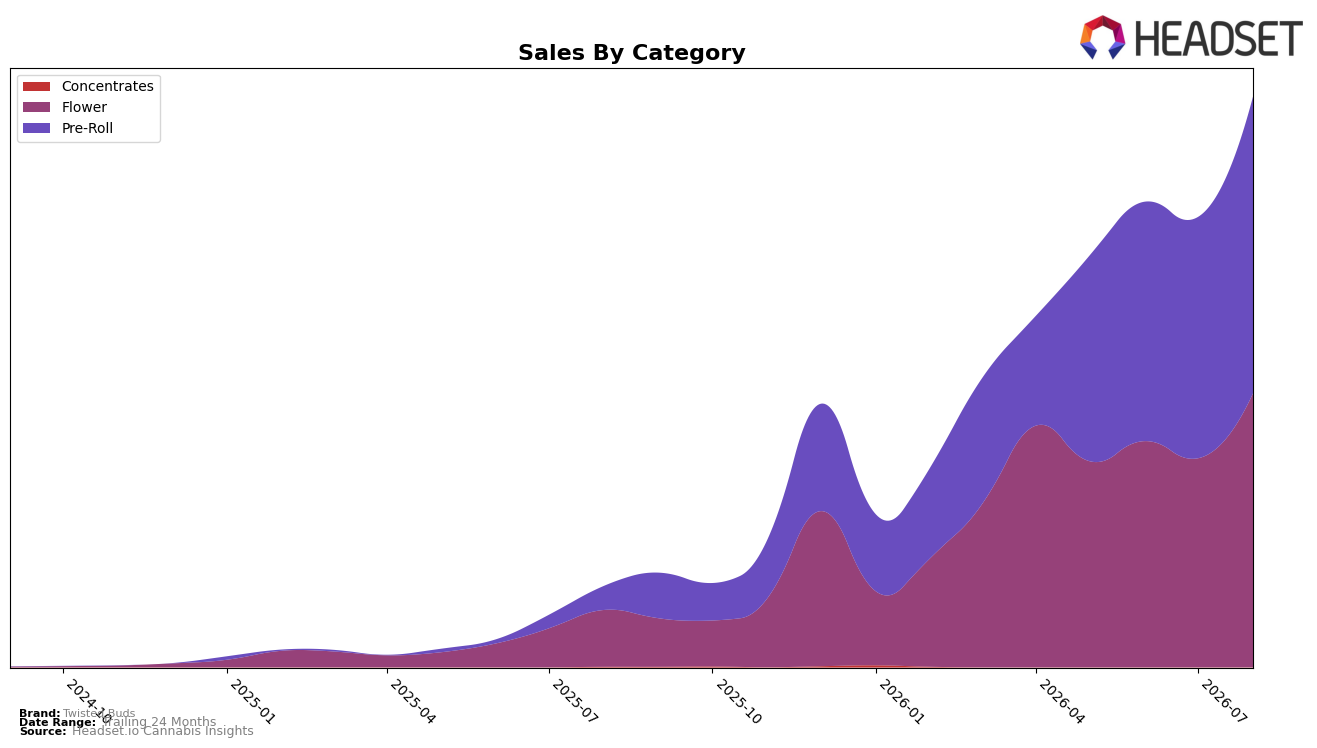
In August 2026, Twisted Buds split its sales almost evenly between Pre-Roll at 52.00% share and Flower at 48.00% share, but the trajectories diverged: Pre-Roll grew 1,144.54% year over year with a 23.07% month-over-month lift, while Flower expanded 384.04% year over year with a 31.16% month-over-month gain. Average prices moved in opposite directions by category, with Pre-Roll averaging $3.79 and Flower at $19.03, aligning with a brand-wide 44.03% year-over-year price decline and a statewide Pre-Roll ranking of 25th in Massachusetts. The pattern implies Twisted Buds is scaling unit volume rapidly in value-priced Pre-Rolls while maintaining a sizable, higher-ticket Flower base, concentrating exposure in Massachusetts where mid-pack rank limits visibility but leaves room for share capture.
The mix shift, with Pre-Roll at 52.00% and Flower at 48.00%, coupled with a 605.37% brand-level year-over-year sales increase and a 44.03% price contraction, implies a volume-led strategy that prioritizes entry-price Pre-Rolls to widen trial while using Flower to anchor revenue. With Pre-Roll up 1,144.54% year over year versus Flower up 384.04%, and Pre-Roll’s 23.07% month-over-month trailing Flower’s 31.16%, the data suggests early saturation in value tiers while premium-adjacent Flower momentum builds from a smaller base. This positions Twisted Buds to defend basket-building in Pre-Roll while selectively trading consumers up in Flower, aiming to convert rank 25 in Massachusetts Pre-Roll into incremental share by balancing unit-led gains with margin from higher-priced Flower.
Competitive Landscape
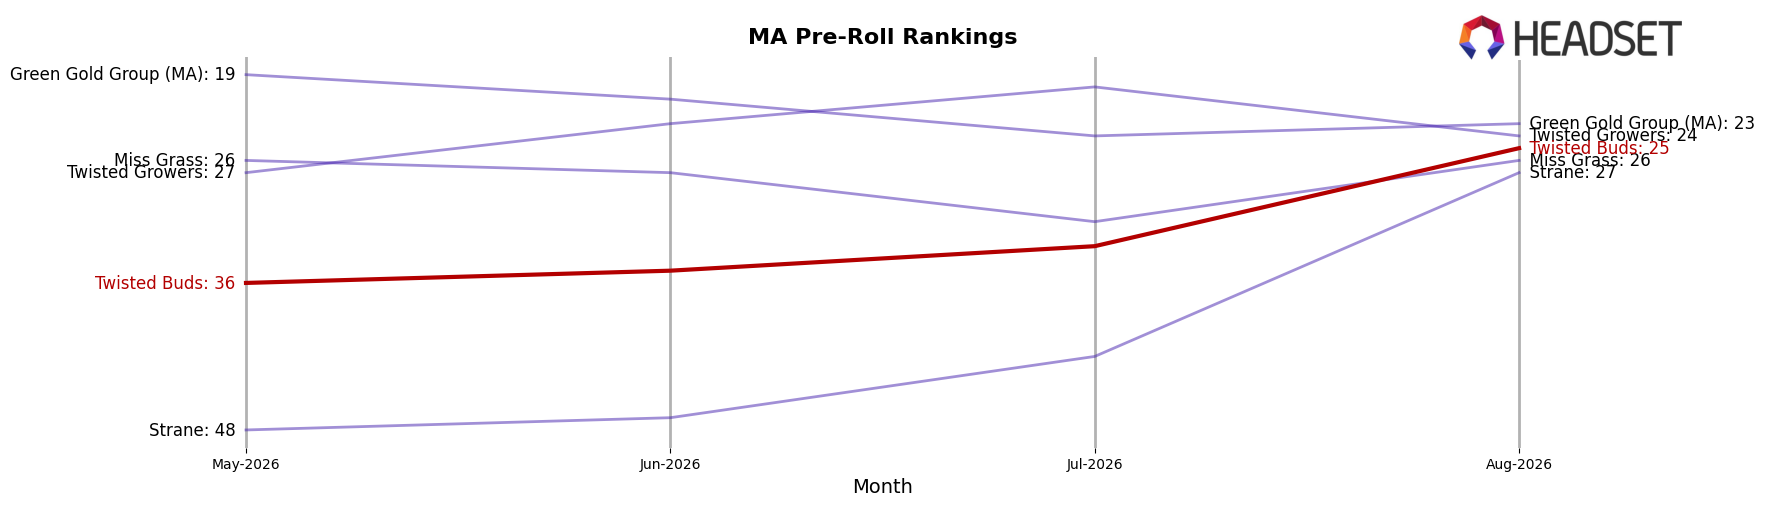
Twisted Buds sits at rank #25 in MA Pre-Roll in August 2026 after climbing 123 positions year over year from #148, and it improved 11 spots versus May 2026 when it was #36; this coincides with hitting a peak rank of #25 in August 2026 and moving within 24 places of the category lead. In contrast, Jeeter held steady at #1 year over year while Cali-Blaze advanced from #6 to #2 alongside a 146.3% YoY sales increase, indicating that Twisted Buds’ rapid rank ascent is occurring amid aggressive top-tier gains and implies a transition from long-tail positioning toward the competitive mid-pack where sustaining share will require continued momentum against leaders.
Notable Products
Fluffernutter Pre-Roll (1g) posted the largest month-over-month surge at 153.99% and jumped to rank 1, while Peanut Butter & Jelly Pre-Roll (1g) climbed 148.05% to rank 3. In contrast, Tropical Smoothie Pre-Roll (1g) fell 51.67% at rank 9 and Italian Ice Pre-Roll (1g) declined 42.16% at rank 10. With all ten top-10 SKUs concentrated in the Pre-Roll category and a split between triple‑digit gainers and double‑digit decliners, the pattern implies a deliberate pivot toward a few breakout flavor-led SKUs while pruning or deprioritizing slower variants, concentrating revenue density in fewer winners.
Top Selling Cannabis Brands






Data for this report comes from real-time sales reporting by participating cannabis retailers via their point-of-sale systems, which are linked up with Headset’s business intelligence software. Headset’s data is very reliable, as it comes digitally direct from our partner retailers. However, the potential does exist for misreporting in the instance of duplicates, incorrectly classified products, inaccurate entry of products into point-of-sale systems, or even simple human error at the point of purchase. Thus, there is a slight margin of error to consider. Brands listed on this page are ranked in the top twenty within the market and product category by total retail sales volume.

