.svg)



Where to Buy
Spinello (OR/IL) is stocked at 135 licensed dispensaries across Washington, Oregon, and 2 other states, 43 of them in Washington, with the deepest coverage in Seattle, Tacoma, Bellingham, Vancouver, and Anacortes. Search by ZIP code or city below to find the closest one, or filter by product type if you are after a specific format.
Market Insights Snapshot
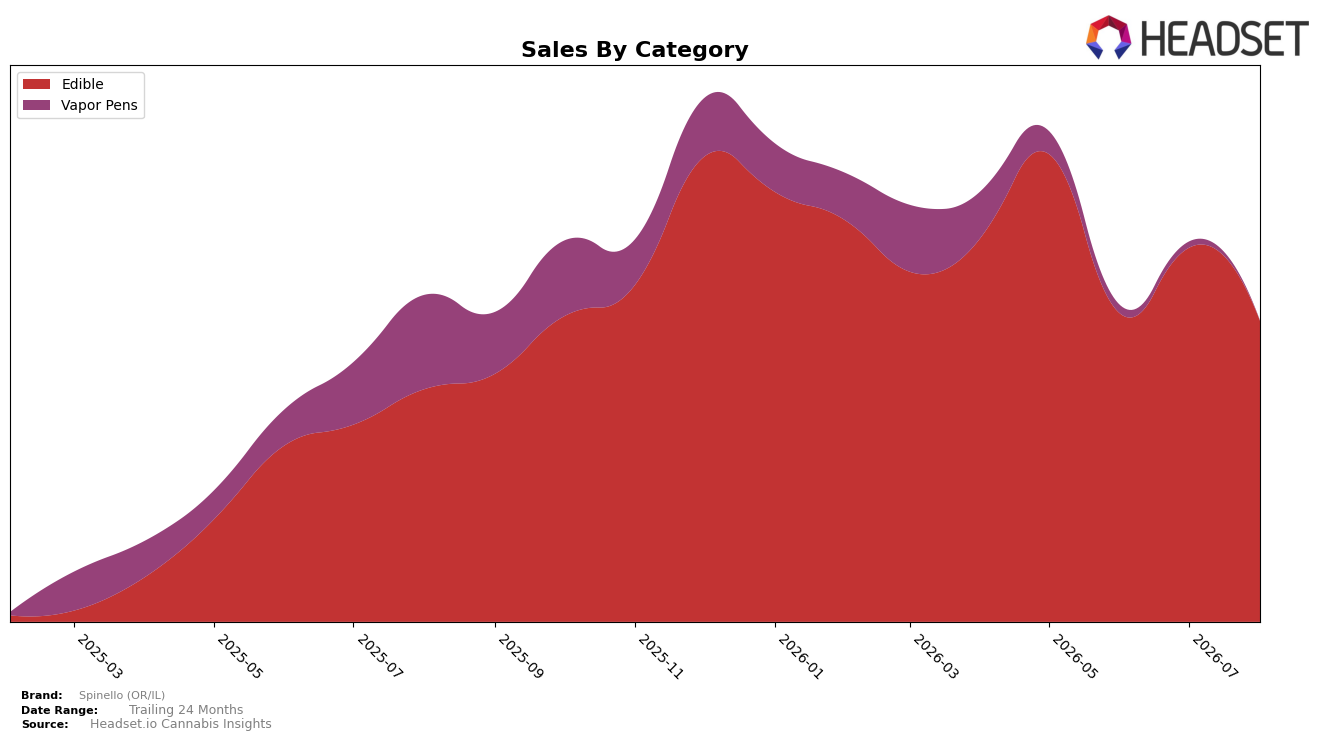
In August 2026, Spinello (OR/IL) concentrated 99.49% of sales in Edible, up 29.22% year over year but down 19.48% month over month, while Vapor Pens fell to 0.51% share with a 98.36% YoY decline and a 78.96% MoM drop. Average price declined 26.74% YoY to $13.50, coinciding with a -7.77% YoY brand sales change and an Edible rank of 23 in Colorado, implying that volume gains in Edibles offset pricing pressure but that month-over-month weakness signals recent demand or distribution frictions.
The sharp pivot toward Edibles alongside a 26.74% YoY price reduction indicates a value-led positioning that trades margin for share, yet the 19.48% MoM decline suggests sensitivity to promo cadence or seasonal elasticity. With Vapor Pens contracting 98.36% YoY and losing 78.96% MoM share-of-wallet momentum, the portfolio risk skews toward a single-category exposure; maintaining Edible share near 99.49% while ranked 23 in Colorado implies the brand must refine price-pack architecture to stabilize MoM trajectories without eroding the YoY volume tailwind.
Competitive Landscape
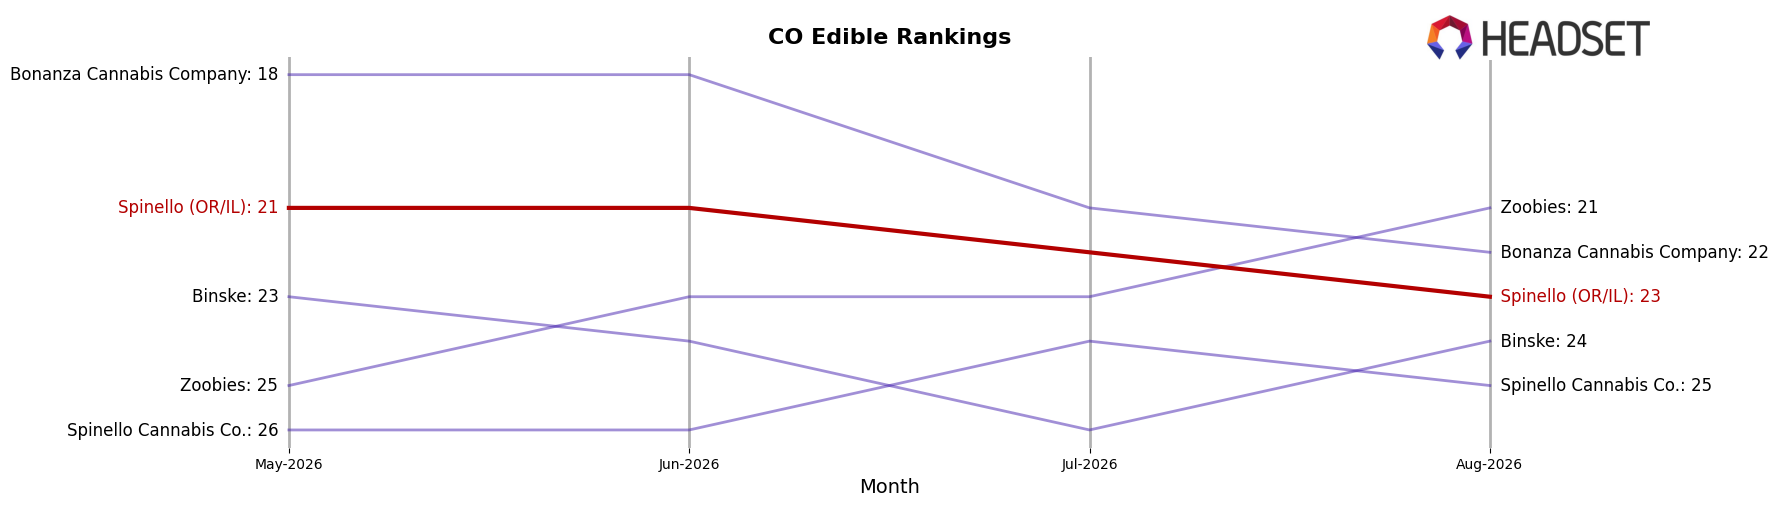
Spinello (OR/IL) sits at rank #23 in Colorado Edible for August 2026, a 54-place climb from #77 year over year, with a 2-position slip from #21 in June 2026 to #23 in August 2026 indicating recent stabilization below its peak. Among leaders, Wyld held #1 year over year to #1 current despite a -29.0% YoY sales change, while Dialed In Gummies moved up from #3 to #2 with +29.7% YoY sales, showing that top-tier momentum is mixed as Spinello (OR/IL) consolidates mid-pack gains. The three-month view shows Spinello (OR/IL) easing from #21 in June 2026 to #23 in August 2026, whereas Wana slipped from #2 YoY to #3 current with -17.3% YoY sales, suggesting Spinello (OR/IL) is benefiting from share rotation even without top-5 velocity; the trajectory implies a durable step-change from last year’s #77 into the low-20s, but further ascent will require displacing incumbents with divergent trends.
Notable Products
Blueberry Rosin Gummies 10-Pack (100mg) posted the steepest decline at -57.4% MoM while sliding to rank 5, and Blueberry Rosin Fruit Chews 10-Pack (100mg) also fell -13.7% at rank 3; with four of the top ten being Blueberry SKUs, the variety’s pullback signals flavor-specific fatigue rather than category softness. Prickly Pear Rosin Gummies 10-Pack (100mg) held rank 1 despite an -8.2% MoM dip, while Peach Rosin Fruit Chews 10-Pack (100mg) rose +7.5% at rank 2, indicating the leadership baton is consolidating around two formats even as single-score Peach contracted -61.8% at rank 9. Mango split the difference with Mango Rosin Fruit Chews 10-Pack (100mg) up +32.6% at rank 6 and Mango Rosin Gummies 10-Pack (100mg) down -13.2% at rank 7, suggesting formulation and texture—not just flavor—are shaping demand. Taken together, August 2026 points to a tilt toward fruit chews over gummies and a need to rebalance away from over-indexed Blueberry lines to stabilize rank 1–3 share, with only one top SKU clearing $14,175.
Top Selling Cannabis Brands






Data for this report comes from real-time sales reporting by participating cannabis retailers via their point-of-sale systems, which are linked up with Headset’s business intelligence software. Headset’s data is very reliable, as it comes digitally direct from our partner retailers. However, the potential does exist for misreporting in the instance of duplicates, incorrectly classified products, inaccurate entry of products into point-of-sale systems, or even simple human error at the point of purchase. Thus, there is a slight margin of error to consider. Brands listed on this page are ranked in the top twenty within the market and product category by total retail sales volume.

