.svg)
Aug-2026
Sales
Trend
6-Month
Product Count
SKUs
Avg Price
YoY Sales Change
YoY Price Change


Where to Buy
Unbranded is stocked at 17 licensed dispensaries across Massachusetts, New Jersey, and Oregon, 8 of them in Massachusetts, with the deepest coverage in Attleboro, Boston, Cambridge, Charlton, and Great Barrington. Search by ZIP code or city below to find the closest one.
Market Insights Snapshot
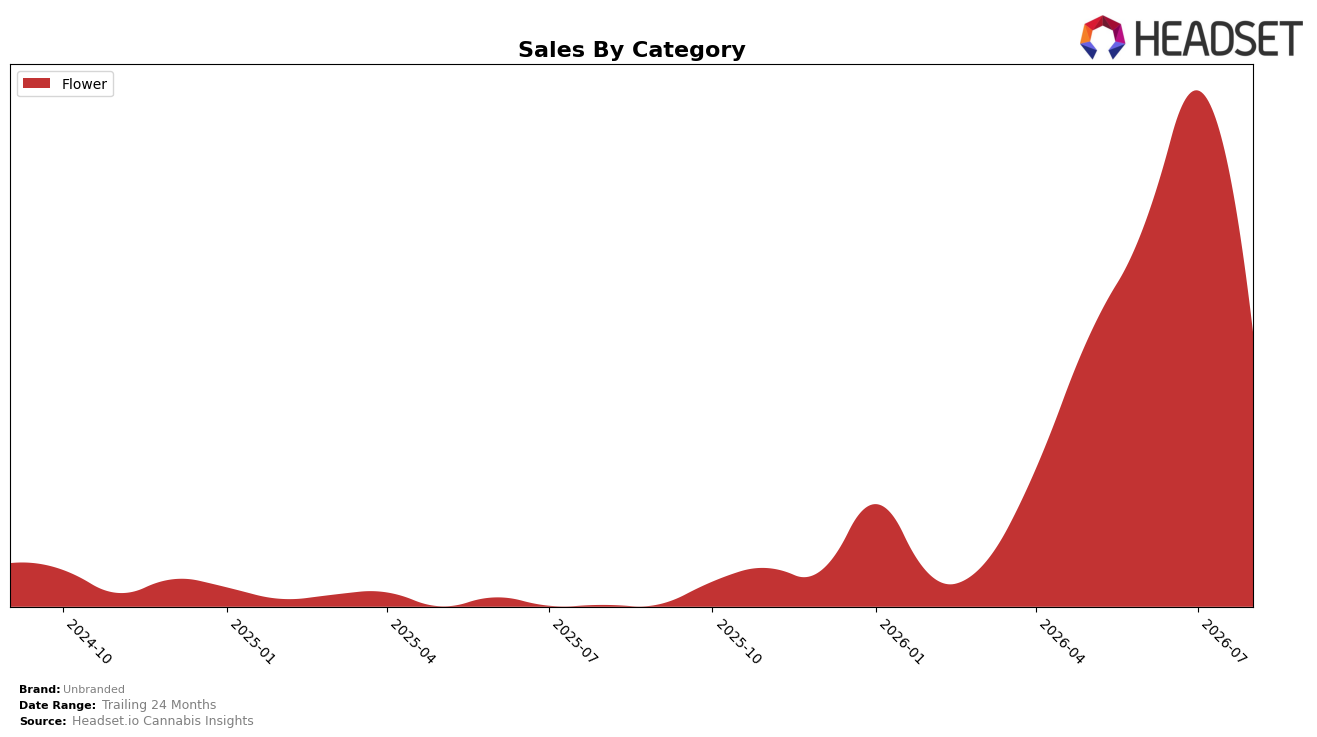
Unbranded concentrated entirely in Flower at 100.0% category share in August 2026, pairing a 5,799.8% year-over-year sales surge with a -46.6% month-over-month contraction, while average price fell -10.3% YoY to $53.04. Within New Jersey Flower, the brand sat at rank 42, indicating that despite the outsized YoY expansion, the single-category concentration and steep MoM pullback compress near-term momentum relative to the state category’s mid-pack performers.
The pattern implies a rollout spike that is normalizing rather than an across-category expansion: the 100.0% reliance on Flower and the -46.6% MoM drawdown suggest volume cooled after initial distribution gains, while the -10.3% YoY price decline points to price-led trial versus sustained premium positioning. With rank 42 in New Jersey Flower alongside a 5,799.8% YoY build, the brand’s path to defensibility hinges on stabilizing monthly sell-through and broadening beyond a single-category footprint rather than leaning further into discount-driven share.
Competitive Landscape
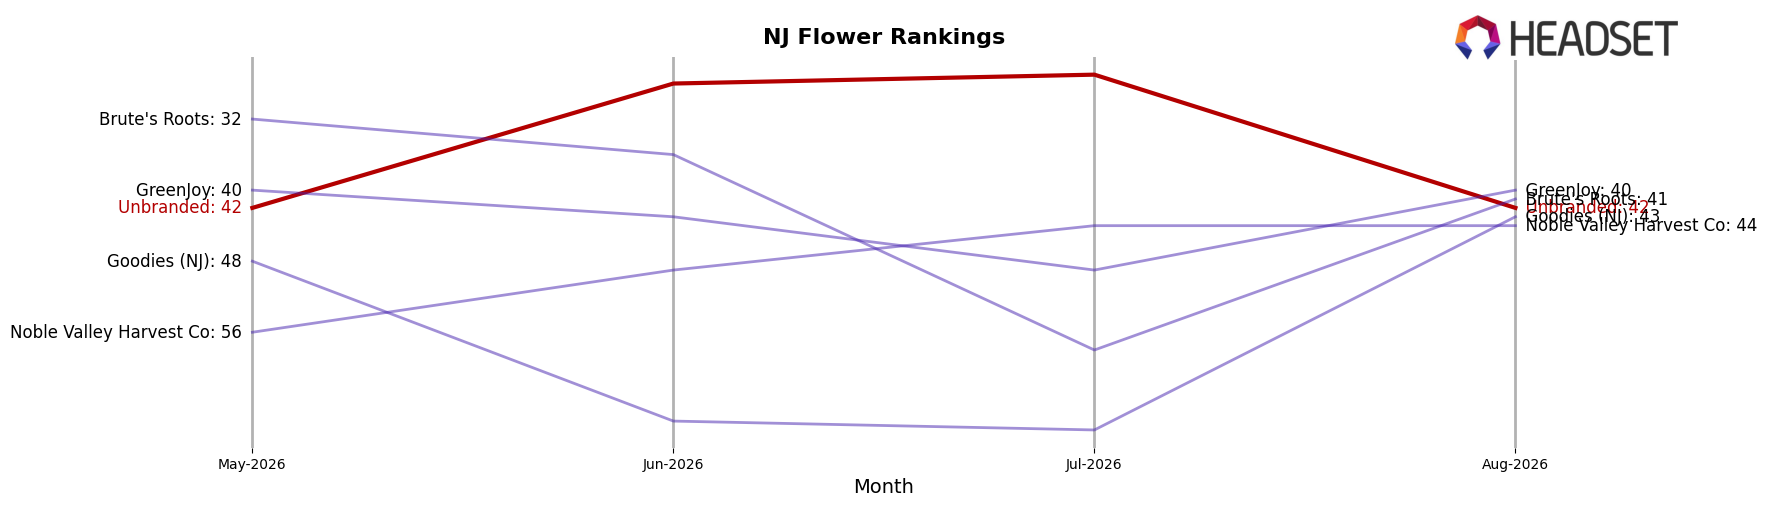
Unbranded sits at rank #42 in New Jersey Flower in August 2026 with no year-over-year rank available, holding flat versus May 2026–August 2026 at #42 while still below its peak of #27 in July 2026; this places it 41 positions behind Ozone, which holds #1 but with a -18.5% year-over-year sales change, and trailing Good Green, which advanced to #3 alongside a 91.6% year-over-year sales increase. The contrast between leaders’ mixed momentum—RYTHM slipping to #5 with -7.3% year-over-year sales while Find. climbed to #2 with +40.5%—and Unbranded’s stationary #42 over three months indicates share is consolidating among faster risers, implying Unbranded’s stagnant rank trajectory risks entrenchment outside the top 30 unless it captures demand from declining incumbents.
Notable Products
Agent Z Smalls (28g) delivered the standout move with a +70.1% month-over-month surge to rank 1 in August 2026, while Bulbz Mixed Buds (28g) fell -56.5% to rank 2. Bulbz (28g) also declined -54.1% and Lemon Creamsicle Shake (28g) dropped -18.8%, indicating that value-size Smalls gained share as traditional 28g formats weakened. With four of the top ten in the Shake subsegment and multiple Mixed Buds SKUs clustered in ranks 2, 5, and 7, the assortment is tilting toward economy and processed flower formats, implying Unbranded is consolidating volume in lower-cost lines to defend rank while premium whole-flower SKUs face pressure.
Top Selling Cannabis Brands






Data for this report comes from real-time sales reporting by participating cannabis retailers via their point-of-sale systems, which are linked up with Headset’s business intelligence software. Headset’s data is very reliable, as it comes digitally direct from our partner retailers. However, the potential does exist for misreporting in the instance of duplicates, incorrectly classified products, inaccurate entry of products into point-of-sale systems, or even simple human error at the point of purchase. Thus, there is a slight margin of error to consider. Brands listed on this page are ranked in the top twenty within the market and product category by total retail sales volume.

