.svg)


Where to Buy
7Sacred is stocked at 26 licensed dispensaries across Colorado, with the deepest coverage in Denver, Commerce City, Lakewood, Longmont, and Arvada. Search by ZIP code or city below to find the closest one.
Market Insights Snapshot
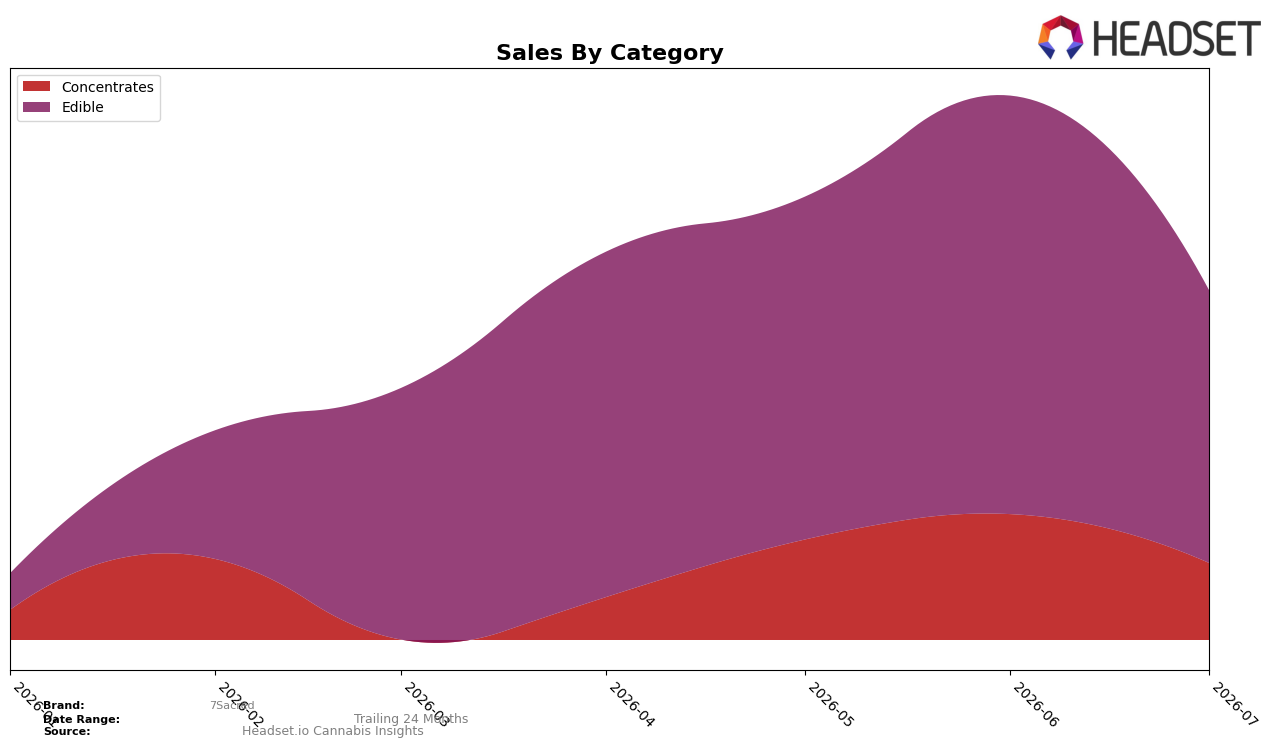
In July 2026, 7Sacred’s mix concentrated in Edible at 78.1% share while Concentrates held 21.9%, with month-over-month declines of 34.8% for Edible and 38.9% for Concentrates indicating category-wide pullback within the brand. The average prices split at $14.57 in Edible versus $18.68 in Concentrates, implying a price-led exposure difference as the higher-priced segment contracted faster MoM by 4.1 percentage points more than Edible; in Colorado, this pattern implies 7Sacred is leaning into lower-priced volume in its lead category while trimming higher-ticket volatility.
The July 2026 shift, where Concentrates dropped more steeply at 38.9% MoM versus 34.8% MoM in Edible and left Edible at 78.1% mix, positions 7Sacred as a value-tilted edible-first brand that buffers revenue swings through a larger base of lower-priced units. With the brand’s overall average price at $15.31 sitting between category averages of $14.57 and $18.68, the mix skews margin risk toward Concentrates while relying on Edible for throughput; this implies prioritizing depth in Edible in Colorado while treating Concentrates as a tactical upsell that may require tighter promo guardrails to avoid mix-driven margin compression.
Competitive Landscape
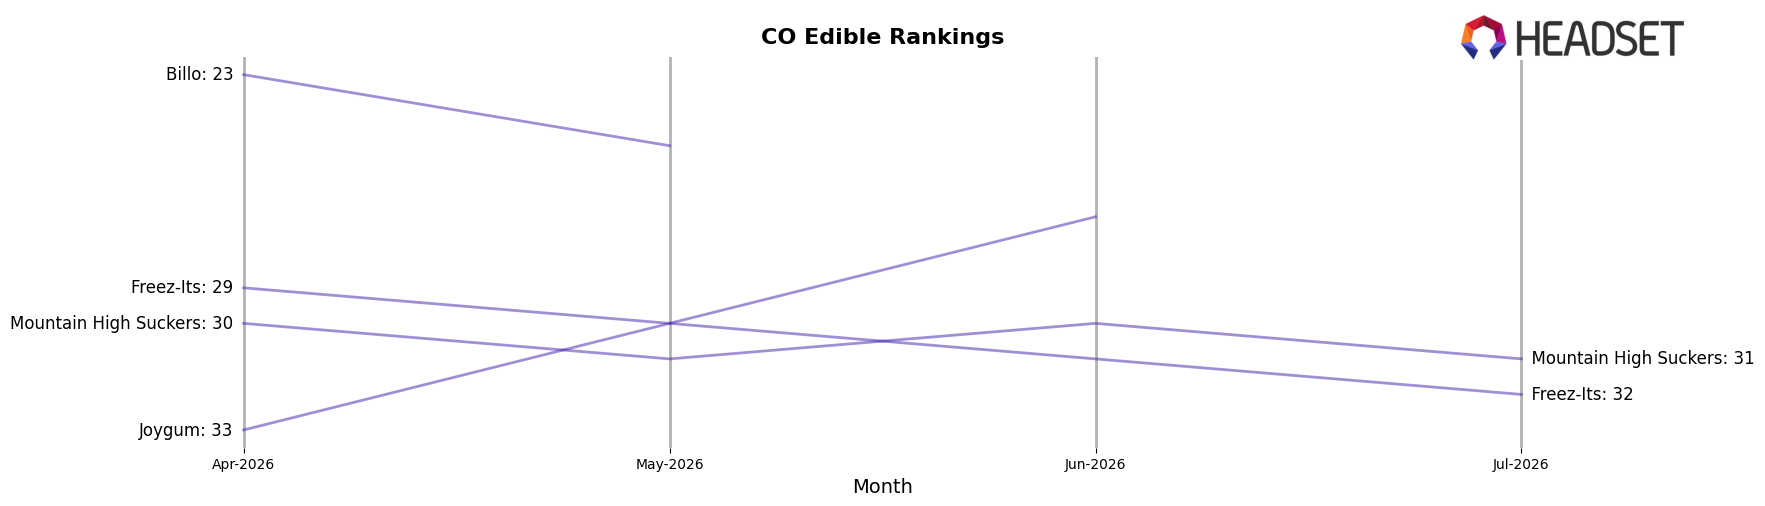
7Sacred is ranked #39 in Colorado Edible for July 2026, down 2 positions from #37 in April 2026, after peaking at #32 in June 2026; the lack of a year-over-year rank baseline contrasts with category leaders where Wyld holds #1 despite a -24.4% sales change and Dialed In Gummies sits at #2 with a +15.8% year-over-year lift. Relative rank stability at the top—Wana at #3 and Ript at #4—paired with 7Sacred’s two-position slide from April 2026 to July 2026 implies that short-lived gains like June 2026’s #32 peak are not yet converting into sustained share and that competitive displacement will require month-to-month retention rather than episodic spikes.
Notable Products
Twilight Berry Terp Tabs Gummies 10-Pack (100mg) posted the steepest decline at -45.33% MoM while sliding to rank 3, and Blood Orange Terp Tabs Gummies 10-Pack (100mg) fell -38.38% yet held rank 1. Sour Cherry Terp Tabs Gummies 10-Pack (100mg) contracted -16.64% at rank 2, and Twilight Berry Terp Tabs (1g) in Concentrates dropped -38.94% at rank 4, with four of the top ten concentrated in Edibles indicating category dependence despite cross-format presence. The combined pattern of a -45.33% plunge in the top-three gummy and a -38.94% fall in the lead concentrate, alongside a -38.38% dip for the category leader, signals a demand air pocket rather than a single-SKU misfire; the product mix implies 7Sacred needs to rebalance away from gummy-heavy exposure to stabilize month-to-month volatility.
Top Selling Cannabis Brands






Data for this report comes from real-time sales reporting by participating cannabis retailers via their point-of-sale systems, which are linked up with Headset’s business intelligence software. Headset’s data is very reliable, as it comes digitally direct from our partner retailers. However, the potential does exist for misreporting in the instance of duplicates, incorrectly classified products, inaccurate entry of products into point-of-sale systems, or even simple human error at the point of purchase. Thus, there is a slight margin of error to consider. Brands listed on this page are ranked in the top twenty within the market and product category by total retail sales volume.

