.svg)



Market Insights Snapshot
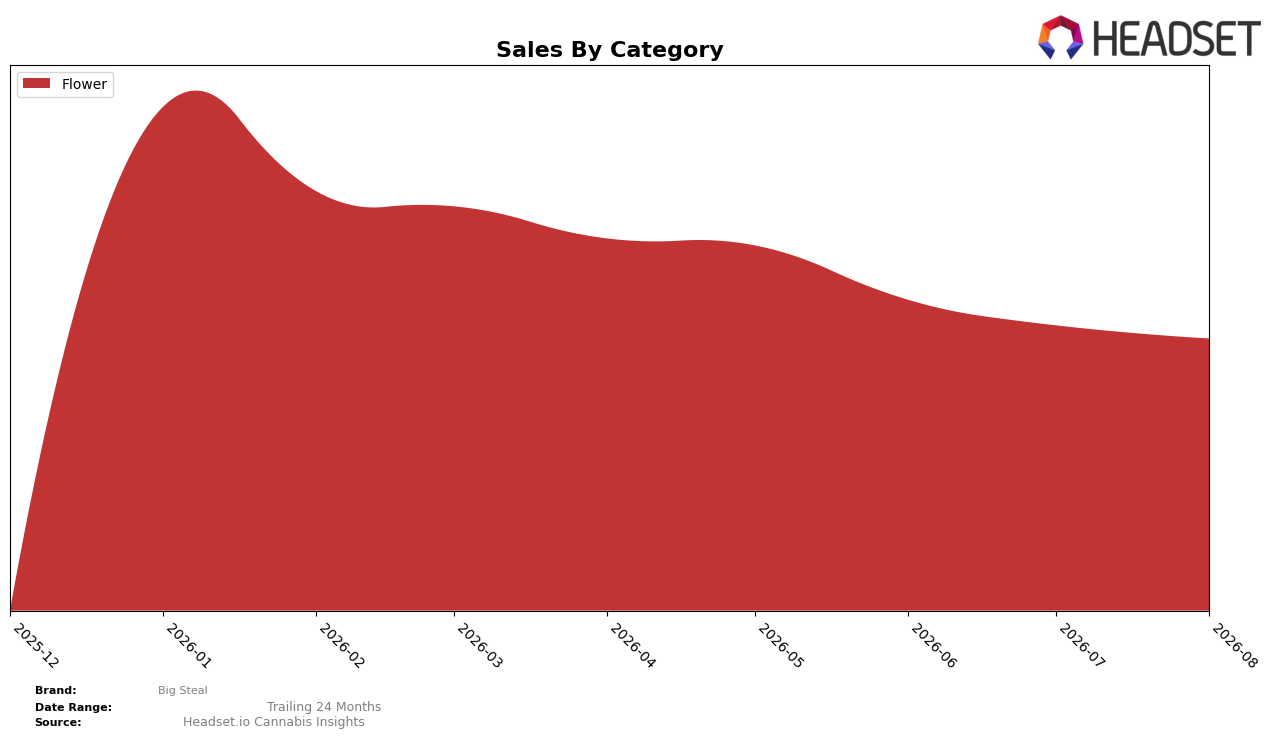
In August 2026, Big Steal operated as a single-category brand with Flower at 100.0% mix, and within that sole lane the month-over-month movement was a -3.80% decline in Flower, while the brand’s category rank in Ontario Flower sat at rank 50. The average price held at $82.16 alongside a -3.80% MoM sales shift, and with year-over-year data unavailable the only directional signal is intra-month pressure against a flat 100.0% mix. The pattern implies that concentration risk is elevated: with no offsetting categories and a rank of 50, even a -3.80% MoM dip directly impacts overall traction and leaves limited levers for balance.
The 100.0% Flower dependency paired with rank 50 in Ontario indicates that Big Steal’s positioning hinges on stabilizing Flower velocity rather than mix-driven hedges, as a -3.80% MoM in the only category equates to a full-brand contraction. With the average price at $82.16 and no YoY signals to validate a price-led strategy, the brand’s path to improved placement likely requires either share capture within Flower or near-term entry into a second category to dilute rank volatility; otherwise, any further -3% to -5% monthly swings could translate directly into rank slippage from 50 toward lower tiers.
Competitive Landscape
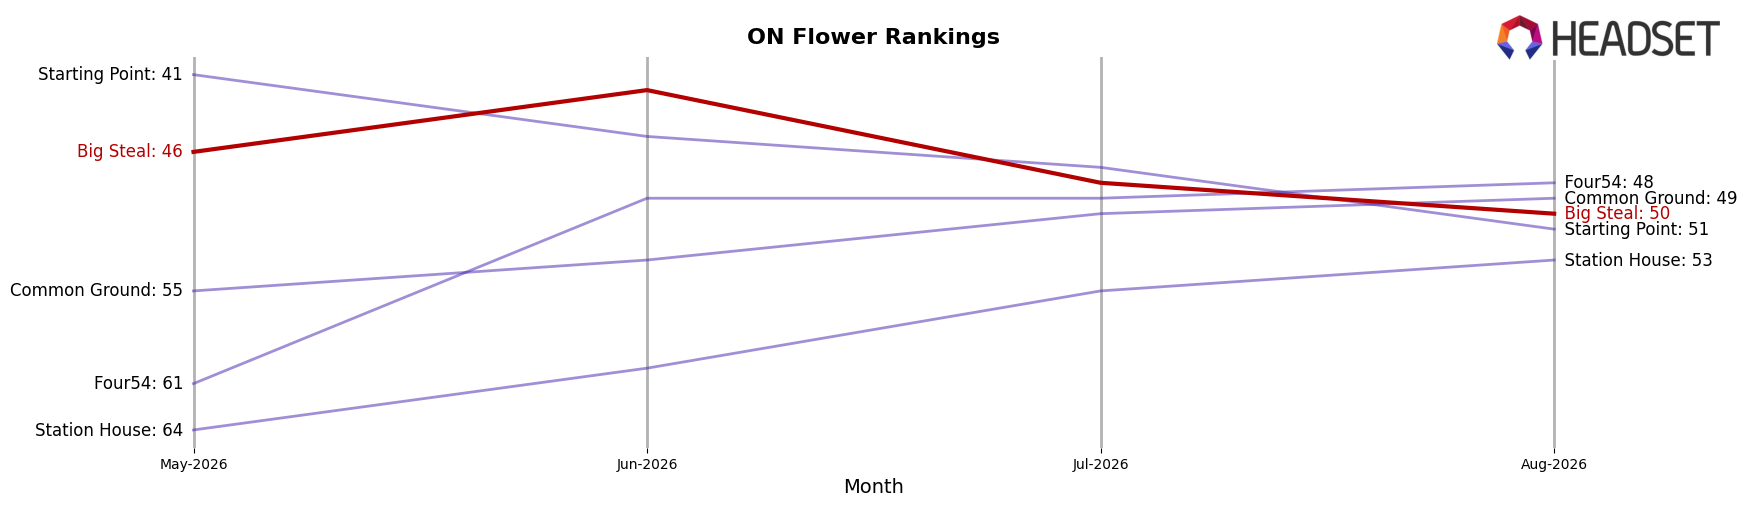
Big Steal sits at rank #50 in ON Flower in August 2026, down 4 positions from #46 in May 2026 and 12 spots below its peak of #38 in January 2026, while year-over-year rank is unavailable; meanwhile, Shred rose to #1 with a +2 YoY rank change and Spinach advanced to #2 with a +4 YoY gain, indicating Big Steal is ceding ladder space as leaders move upward. Compared with Back Forty / Back 40 Cannabis holding #3 with +3 YoY momentum and Big Bag O' Buds at #4 with a +1 YoY shift, Big Steal’s slide from #46 to #50 over three months contrasts with competitors’ upward or stable positioning; even The Original Fraser Valley Weed Co. remains #5 despite a -17.49% YoY sales change, further underscoring that Big Steal’s rank drift is more about relative share loss than category contraction. The pattern implies a medium-term erosion of competitiveness: falling 4 ranks since May 2026 and sitting 12 places below the January 2026 peak suggests that without a change in mix or price architecture, Big Steal will continue to be outranked by brands gaining or defending positions.
Notable Products
Mango Sapphire (28g) led August 2026 despite a -5.8% month-over-month dip and holding rank 1, which indicates the category leader absorbed a decline without ceding position. Bonkers (28g) slipped -0.03% MoM while staying at rank 2, and with both top SKUs in Flower, two of the top two fall within a single category concentration that elevates dependency risk. The combined pattern of a top-ranked product contracting -5.8% and the runner-up flat at -0.03% signals a plateau at the peak, implying Big Steal’s commercial direction hinges on deepening differentiation within Flower or diversifying beyond it.
Top Selling Cannabis Brands






Data for this report comes from real-time sales reporting by participating cannabis retailers via their point-of-sale systems, which are linked up with Headset’s business intelligence software. Headset’s data is very reliable, as it comes digitally direct from our partner retailers. However, the potential does exist for misreporting in the instance of duplicates, incorrectly classified products, inaccurate entry of products into point-of-sale systems, or even simple human error at the point of purchase. Thus, there is a slight margin of error to consider. Brands listed on this page are ranked in the top twenty within the market and product category by total retail sales volume.

