.svg)

Aug-2026
Sales
Trend
6-Month
Product Count
SKUs
Avg Price
YoY Sales Change
YoY Price Change


Where to Buy
BNKR is stocked at 66 licensed dispensaries across Missouri, with the deepest coverage in Kansas City, St. Louis, Joplin, Springfield, and Branson. Search by ZIP code or city below to find the closest one, or filter by product type if you are after a specific format.
Market Insights Snapshot
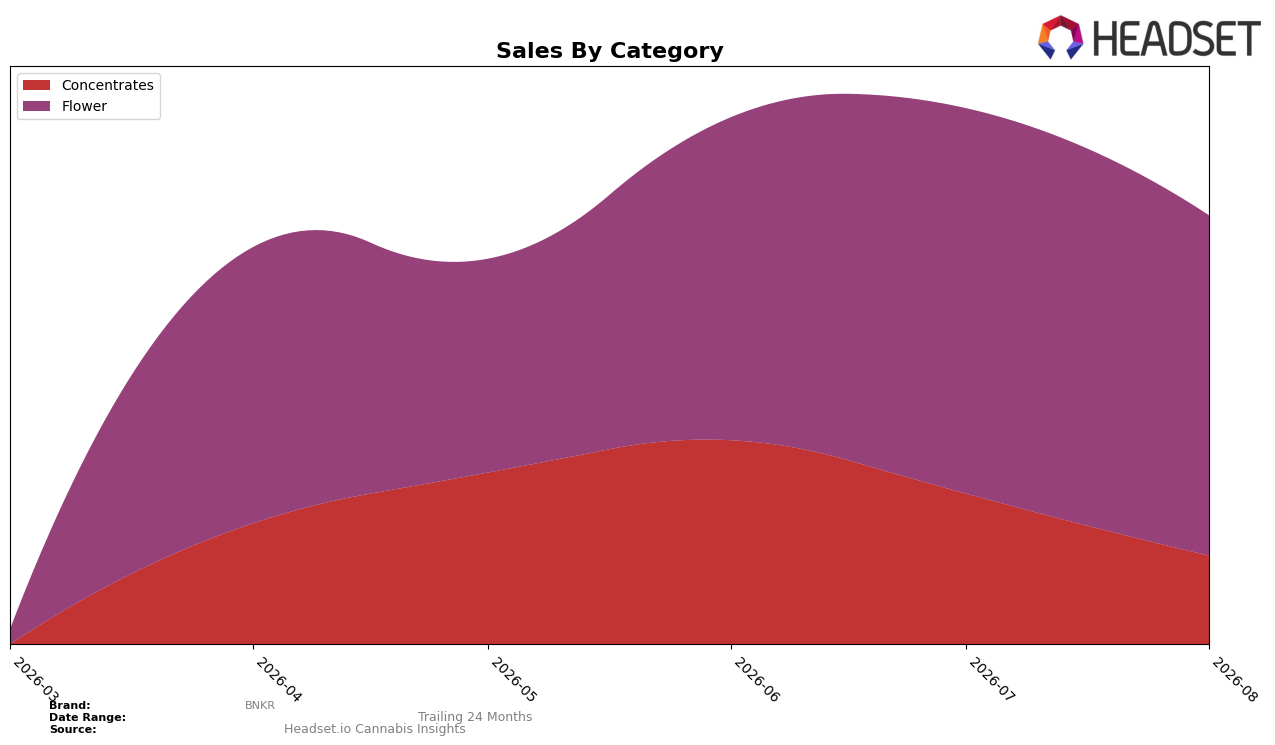
BNKR’s August 2026 mix concentrated in Flower at 79.27% share while Concentrates held 20.73%, with month-over-month declines of 11.68% in Flower and 41.05% in Concentrates indicating a sharper pullback in the latter. Average prices diverged, with Flower at $46.50 versus Concentrates at $33.14, and BNKR’s Flower rank in Missouri sat at 55, placing the brand mid-pack rather than top-tier in that category. With Concentrates shrinking nearly 29.38 percentage points faster than Flower and share still anchored in Flower at 79.27%, the pattern implies BNKR is more exposed to category volatility in Concentrates but remains positioned to manage volume through Flower where its rank at 55 in Missouri suggests room for targeted efficiency rather than broad expansion.
The mix shift and pricing spread suggest BNKR’s positioning should prioritize maintaining Flower’s 79.27% share while addressing Concentrates’ 41.05% month-over-month contraction with SKU rationalization or pricing posture near the $33.14 average. Given the August 2026 Flower pullback of 11.68% concurrent with a Missouri rank of 55, BNKR can trade rank stability for margin by holding to $46.50 in Flower while redeploying promotional intensity toward Concentrates to buffer a swing that is 3.5x the Flower decline. The implication is that BNKR can preserve category breadth but must reweight investment toward channels and formats that reduce Concentrates’ volatility without diluting Flower’s price architecture.
Competitive Landscape
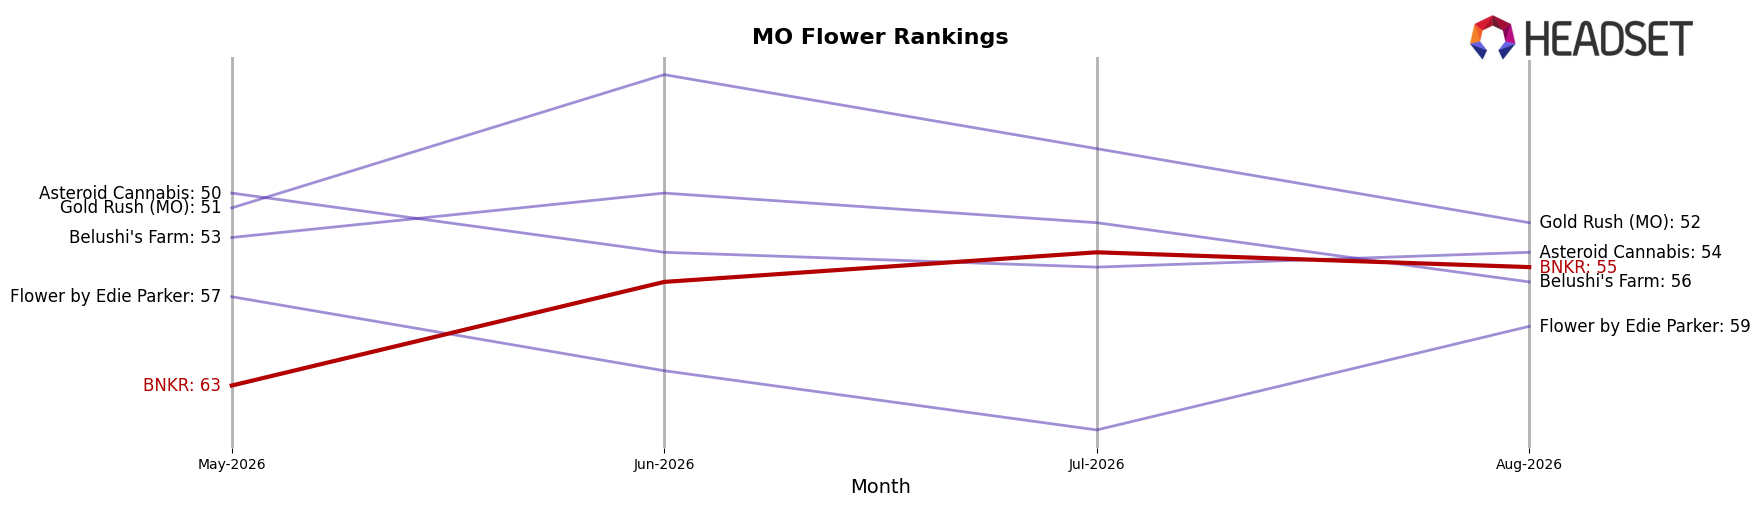
BNKR sits at rank #55 in Missouri Flower for August 2026, up 8 positions from #63 in May 2026 but down 1 spot from its peak at #54 in July 2026; this places BNKR far from leaders where Flora Farms holds #1 with a 2.74% year-over-year sales increase while Illicit / Illicit Gardens is #2 despite a -5.02% year-over-year change. Compared with three-month momentum, BNKR’s 8-rank climb contrasts with Farmer G vaulting to #5 from #31 year-over-year alongside a 434.59% sales expansion, and Amaze Cannabis reaching #4 from #6 year-over-year with a 16.68% rise; the implication is that BNKR’s mid-pack ascent lacks the velocity of top movers, signaling a need to convert short-term rank gains into sustained share capture before faster-climbing rivals widen the gap.
Notable Products
Blue Dream Live Diamonds & Sauce (1g) posted the largest month-over-month gain at 97.7% to rank 4, while Indica Infused Ready-To-Roll (4g) fell 57.8% to rank 3, signaling a pivot in demand away from one Ready-To-Roll variant toward a standout concentrate. Sativa Infused Ready-To-Roll (4g) rose 59.1% to rank 1, whereas Hybrid Infused Ready-To-Roll (4g) increased 12.3% to rank 2, and six of the top ten are Concentrates that mostly declined between -20.5% and -79.9%. The spread between a 97.7% surge and declines of -59.6% to -79.9% across multiple concentrate SKUs implies BNKR’s August 2026 mix is consolidating around a few winners rather than broad-based growth, pointing to a concentration strategy around the highest-velocity formats.
Top Selling Cannabis Brands






Data for this report comes from real-time sales reporting by participating cannabis retailers via their point-of-sale systems, which are linked up with Headset’s business intelligence software. Headset’s data is very reliable, as it comes digitally direct from our partner retailers. However, the potential does exist for misreporting in the instance of duplicates, incorrectly classified products, inaccurate entry of products into point-of-sale systems, or even simple human error at the point of purchase. Thus, there is a slight margin of error to consider. Brands listed on this page are ranked in the top twenty within the market and product category by total retail sales volume.

