.svg)


Where to Buy
Dealer's Choice (MO) is stocked at 84 licensed dispensaries across Michigan, Missouri, and 2 other states, 46 of them in Michigan, with the deepest coverage in Detroit, Monroe, New Buffalo, Battle Creek, and Center Line. Search by ZIP code or city below to find the closest one, or filter by product type if you are after a specific format.
Market Insights Snapshot
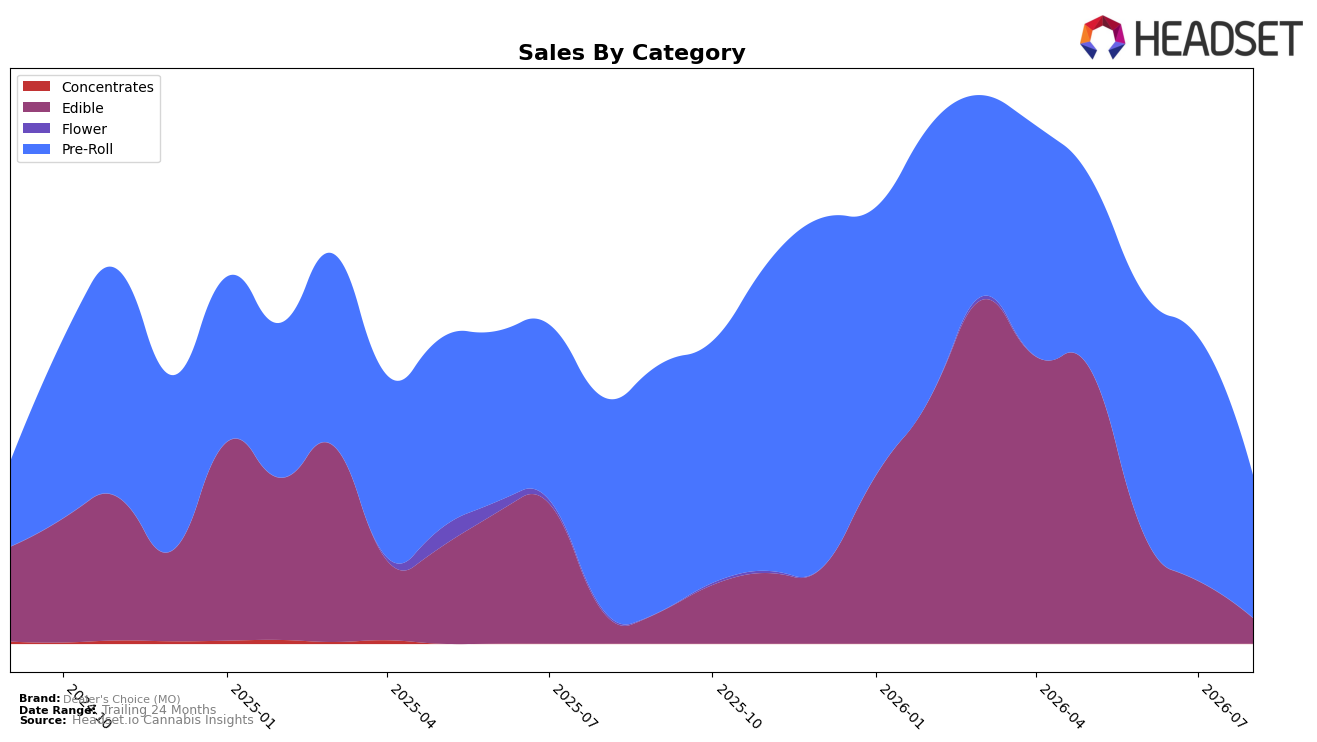
Dealer's Choice (MO) concentrated 84.94% of August 2026 sales in Pre-Roll while Edible accounted for 15.06%, with Pre-Roll down 33.27% year over year and 41.58% month over month, and Edible down 16.52% year over year and 59.57% month over month. The brand’s average price fell 8.45% year over year to $5.24 even as total brand sales declined 31.71% year over year, and within Pre-Roll the average price sat at $6.97, indicating mix and volume, not just price, drove the contraction. With Pre-Roll ranked 42 in Missouri for August 2026 and Pre-Roll share still above four-fifths, the pattern implies overexposure to a weakening flagship category where sharp month-over-month pullback concentrates risk.
The divergence between a 41.58% month-over-month drop in Pre-Roll and a 59.57% month-over-month drop in Edible compresses diversification just as overall brand sales are down 31.71% year over year but up 23.57% over 24 months, implying the long-run base persists while short-run volatility increases. With Pre-Roll holding 84.94% share alongside a 33.27% year-over-year decline and Edible limited to 15.06% share despite a smaller 16.52% year-over-year decline, the brand’s positioning skews toward scale in a sliding category rather than balance across categories; this suggests priority on stabilizing Pre-Roll rank 42 in Missouri while selectively expanding Edible to reduce sensitivity to single-category swings.
Competitive Landscape
Dealer's Choice (MO) sits at rank #42 in MO Pre-Roll in August 2026, down 3 positions year over year from #39 and slipping 6 spots since May 2026 from #36, while still trailing its December 2025 peak of #26; meanwhile, Jeeter holds #1 and Sinse Cannabis climbed to #2 from #6 with 89.8% YoY sales growth as Illicit / Illicit Gardens advanced to #3 from #6 with 29.5% YoY growth, contrasting with Good Day Farm sliding to #5 despite a 38.3% YoY sales decline; this pattern implies Dealer's Choice (MO) is losing relative shelf velocity in a tier where fast-rising incumbents are concentrating share, and its downward rank trajectory signals eroding competitive position unless rank recovers toward the prior #26 peak.

Notable Products
Kansas City Diesel Pre-Roll (1g) posted the standout move with +222% month over month to rank 1, while Watermelon Punch Gummies 10-Pack (200mg) fell -69% to rank 3, signaling a sharp tilt toward inhalables at the top. Pre-Rolls occupied four of the top ten, with Grandi Candi Pre-Roll (1g) sliding -5.5% at rank 2 and Do-Si-Dos Pre-Roll (1g) plunging -87% at rank 9, indicating volatility within the same format alongside a breakout leader. Edibles showed broad contraction with Juicy Jolt Gummies 4-Pack (200mg) down -44% at rank 6 and Tropic Strawberry Gummies 10-Pack (200mg) down -28% at rank 8, and only one SKU in the top three, suggesting the category ceded share to Pre-Rolls. The mix points to Dealer's Choice (MO) concentrating commercial momentum behind a flagship Pre-Roll while pruning or repositioning weaker Edible SKUs to stabilize category balance.
Top Selling Cannabis Brands






Data for this report comes from real-time sales reporting by participating cannabis retailers via their point-of-sale systems, which are linked up with Headset’s business intelligence software. Headset’s data is very reliable, as it comes digitally direct from our partner retailers. However, the potential does exist for misreporting in the instance of duplicates, incorrectly classified products, inaccurate entry of products into point-of-sale systems, or even simple human error at the point of purchase. Thus, there is a slight margin of error to consider. Brands listed on this page are ranked in the top twenty within the market and product category by total retail sales volume.

