.svg)
Aug-2026
Sales
Trend
6-Month
Product Count
SKUs
Avg Price
YoY Sales Change
YoY Price Change


Where to Buy
hai. is stocked at 23 licensed dispensaries across New York, with the deepest coverage in New York, Brooklyn, Queens, Staten Island, and Binghamton. Search by ZIP code or city below to find the closest one, or filter by product type if you are after a specific format.
Market Insights Snapshot
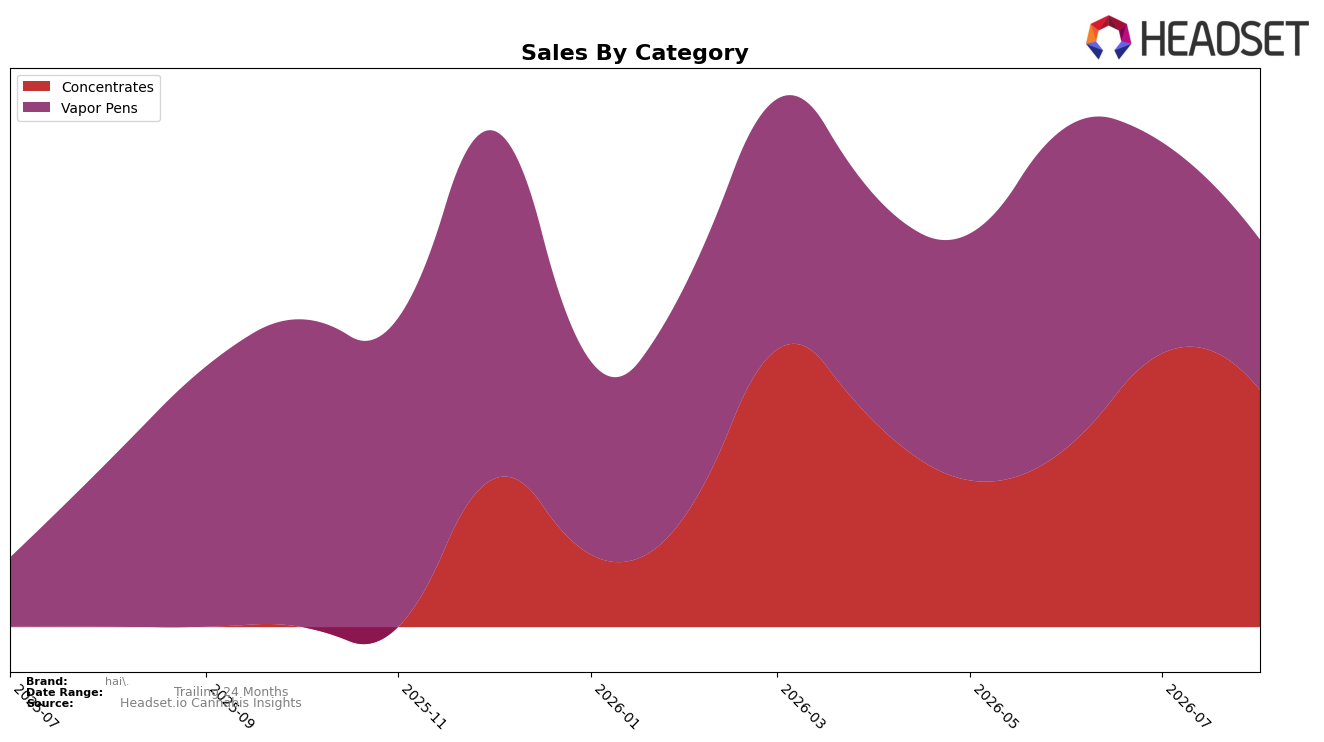
In August 2026, hai.’s category mix concentrated around Concentrates at 61.21% share (ranked 38th in New York Concentrates) while Vapor Pens carried 38.79% share; this split coincided with a 134.83% brand sales YoY increase and a 26.54% YoY drop in average price. Month over month, Concentrates declined 13.35% while Vapor Pens contracted 28.79%, tilting mix further toward Concentrates despite Vapor Pens maintaining over a third of sales; the net effect is a portfolio leaning into Concentrates with a sharper relative pullback in Vapor Pens, implying price-led volume capture offset by short-term momentum loss.
The mix and price trajectory imply hai. is competing on accessibility within premium-leaning formats: a 26.54% YoY price reduction alongside a 61.21% Concentrates share suggests elastic demand converting into unit growth even as the category rank at 38 constrains visibility. With Vapor Pens falling 28.79% MoM versus a 13.35% MoM dip in Concentrates, the near-term positioning tilts toward Concentrates defensibility in New York, while the 38.79% Vapor Pens share remains a lever for recovery if price architecture and assortment are recalibrated; the pattern implies mix-led resilience depends on stabilizing Vapor Pens without eroding Concentrates price-value gains.
Competitive Landscape
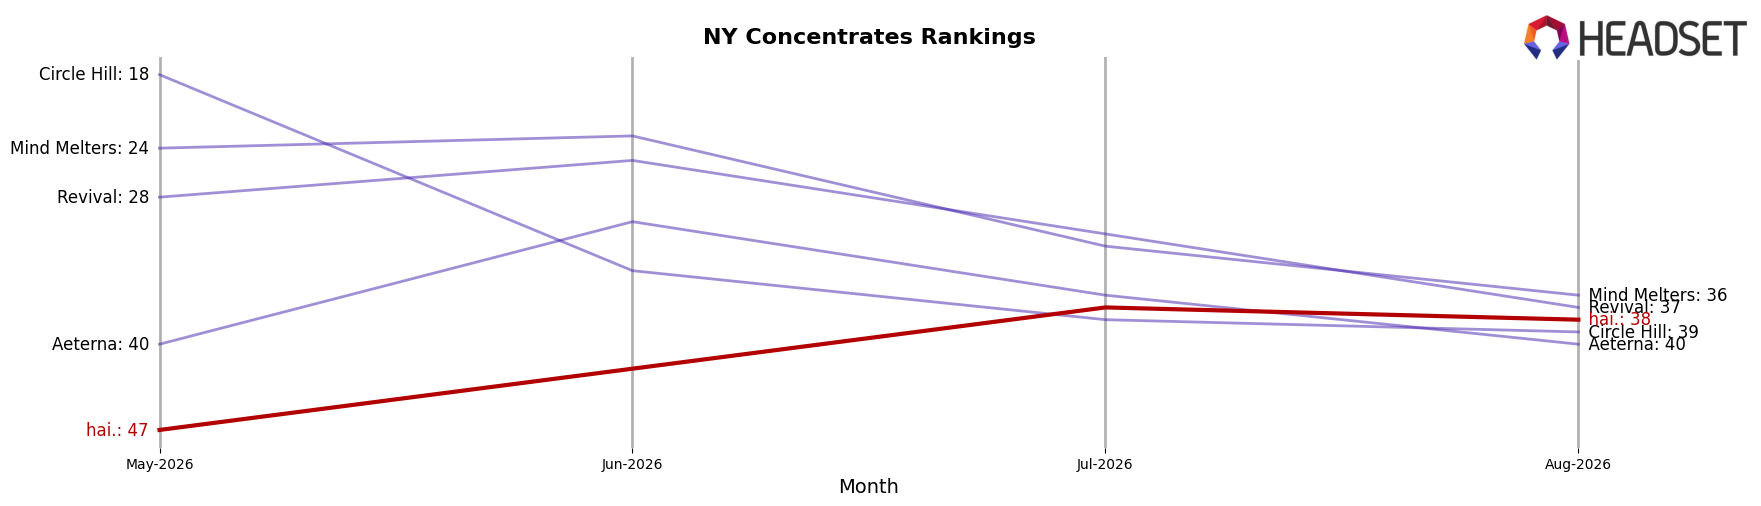
hai. sits at rank #38 in NY Concentrates in August 2026, improving 9 positions from #47 in May 2026 and slipping 1 spot from its peak at #37 in July 2026; that 1-rank pullback alongside a 9-rank three-month climb suggests momentum with recent friction. At the top end, Mfny (Marijuana Farms New York) holds #1 with a 0-position YoY change while growing sales 42.4%, and UMAMII surged from #33 to #3 with 3,294.5% sales growth, indicating that share is consolidating among faster risers than hai.; meanwhile, Nyce advanced from #8 to #5 as Jetpacks held #2 with a 13.1% YoY lift, framing hai.’s #38 position as stable but lagging the pace of leaders; the pattern implies hai.’s rank trajectory is upward but at risk of being outpaced unless conversion accelerates beyond single-rank monthly gains.
Notable Products
Apple Nocturne Live Rosin (1g) posted the largest month-over-month surge at 84.8% to reach rank 4, while Basil Bomb Rosin Disposable (0.5g) fell 20.0% to rank 3 and Berry Cooler Rosin Disposable (0.5g) slid 36.9% to rank 7. At the top, Papaya Sunrise Live Rosin Disposable (0.5g) declined 10.8% yet held rank 1 with $5,925, and Dragonfruit Daydream Live Rosin (1g) contracted 29.4% to rank 6 as Strawguava Live Rosin (1g) dropped 45.6% to rank 9. Four of the top ten are Concentrates with mixed momentum — Strawberry Muse Live Rosin Jar (1g) inched up 5.9% to rank 5 while Lemon Libertine Live Rosin (1g) fell 32.5% to rank 8 — implying a pivot from Vapor Pens toward higher-velocity Live Rosin jars where volatility is yielding share gains.
Top Selling Cannabis Brands






Data for this report comes from real-time sales reporting by participating cannabis retailers via their point-of-sale systems, which are linked up with Headset’s business intelligence software. Headset’s data is very reliable, as it comes digitally direct from our partner retailers. However, the potential does exist for misreporting in the instance of duplicates, incorrectly classified products, inaccurate entry of products into point-of-sale systems, or even simple human error at the point of purchase. Thus, there is a slight margin of error to consider. Brands listed on this page are ranked in the top twenty within the market and product category by total retail sales volume.

