.svg)


Where to Buy
Koala Cannabis Co. is stocked at 49 licensed dispensaries across Colorado, Washington, and 2 other states, 34 of them in Colorado, with the deepest coverage in Colorado Springs, Denver, Boulder, Pueblo, and Pueblo West. Search by ZIP code or city below to find the closest one, or filter by product type if you are after a specific format.
Market Insights Snapshot
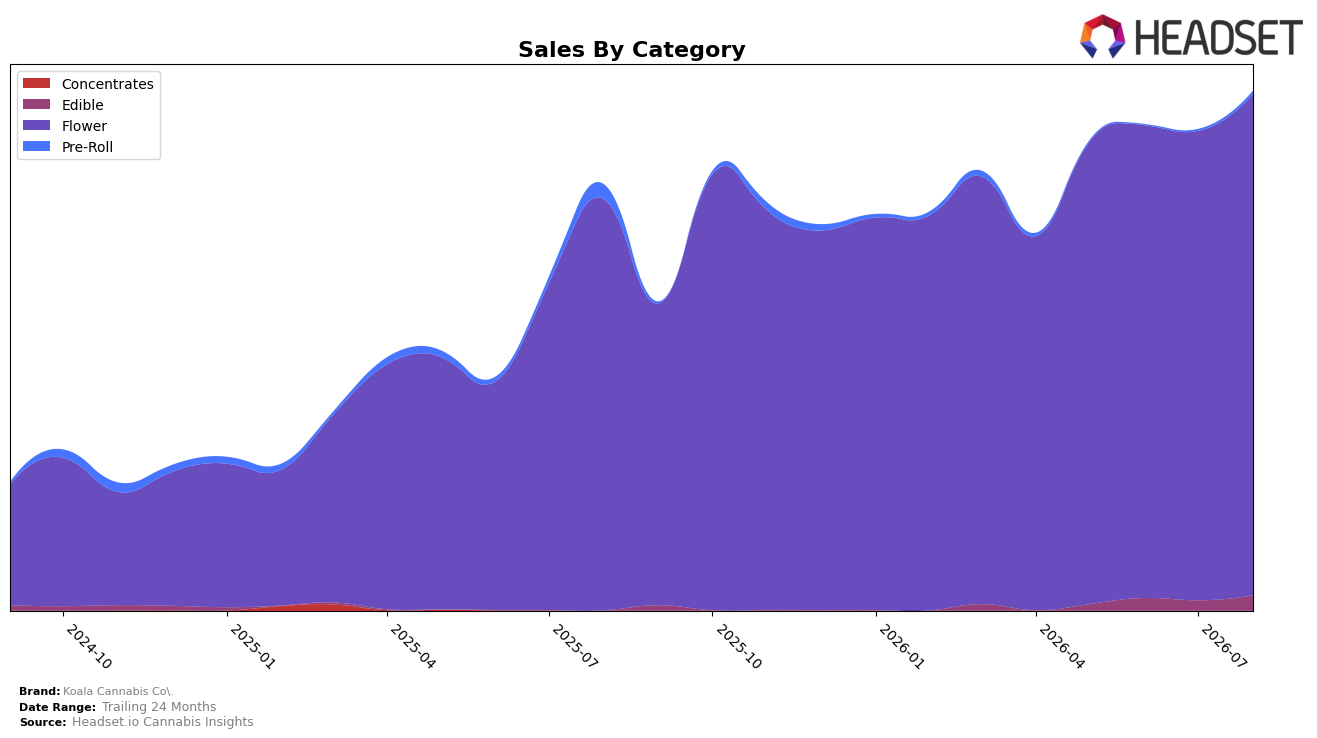
In August 2026, Koala Cannabis Co. concentrated 96.54% of sales in Flower, where year-over-year sales grew 22.06% and month-over-month rose 6.81%, while the brand’s overall average price fell 11.41% YoY to $13.95. Edible expanded to a 2.90% share with a 51.20% MoM lift (YoY unavailable), and Pre-Roll held 0.56% share despite a -80.05% YoY decline paired with a 93.45% MoM rebound. With Flower ranked 43 in Washington for the category, the mix indicates a reliance on one category for volume alongside early signals of diversification, implying August 2026 momentum is driven by price-accessible Flower gains while secondary formats are testing traction.
The combination of a 22.06% YoY increase in Flower against an 11.41% YoY price decrease suggests volume-led expansion, while the 51.20% MoM surge in Edible and the 93.45% MoM uptick in Pre-Roll indicate opportunistic trial rather than established demand. Holding a 96.54% Flower share with a #43 rank in Washington implies headroom if price-led conversion can sustain, but the -80.05% YoY in Pre-Roll alongside a small 0.56% share constrains cross-format reach; together, these shifts imply positioning as a value-forward Flower specialist that can convert incremental buyers in Flower now while using Edible growth as a low-risk option to build a second pillar.
Competitive Landscape
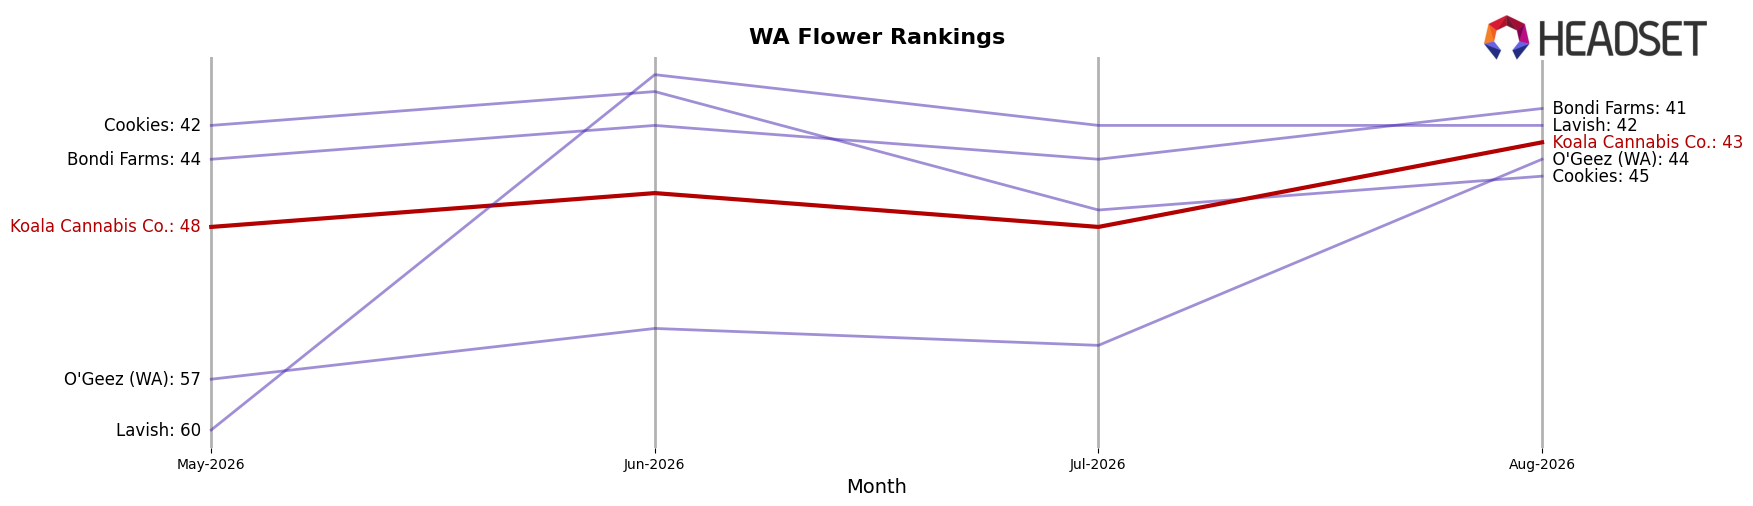
Koala Cannabis Co. sits at rank #43 in WA Flower in August 2026, a 13-place improvement from #56 year over year, and a 5-place climb from #48 three months ago to its peak rank of #43. Against market leaders, Phat Panda held #1 year over year with a 23.7% sales increase while staying #1 in August 2026, and Lifted Cannabis Co advanced from #8 to #4 alongside a 10.8% sales gain, indicating that Koala’s ascent occurred while top-tier rivals either maintained or advanced positions. With Legends static at #2 year over year despite a 10.5% sales decline and EZ Flower / EZ Puff / EZ-Joint slipping from #3 to #5 on a 17.7% sales contraction, Koala’s 13-rank YoY improvement alongside a 5-rank lift quarter-on-quarter implies momentum into the middle tier, but still distant from the top-5 cluster where gains by #1 and #4 signal a rising performance bar.
Notable Products
Purple Picasso B-Buds (3.5g) posted the steepest decline in August 2026 at -12.1% MoM while slipping to rank 2, and Sharknado B-Buds (3.5g) rose 13.5% MoM but stayed at rank 10, indicating momentum is concentrated at the edges rather than the middle. Power B-Buds (3.5g) advanced 34.0% MoM to rank 8 while Tahitian Orange Limeade B-Buds (3.5g) held rank 1 despite no reported MoM figure, and nine of the top ten are Flower SKUs with five B-Buds in the 3.5g size, pointing to a value-size concentration. Ice Cream Zoap B-Buds (7g) at rank 7 and Ice Cream Man (7g) at rank 6 together signal stable demand for larger formats even as the 3.5g B-Buds tier accounts for half of the top ten; the mix implies Koala Cannabis Co. is leaning into budget-friendly B-Buds while keeping 7g packs as a basket-size anchor.
Top Selling Cannabis Brands






Data for this report comes from real-time sales reporting by participating cannabis retailers via their point-of-sale systems, which are linked up with Headset’s business intelligence software. Headset’s data is very reliable, as it comes digitally direct from our partner retailers. However, the potential does exist for misreporting in the instance of duplicates, incorrectly classified products, inaccurate entry of products into point-of-sale systems, or even simple human error at the point of purchase. Thus, there is a slight margin of error to consider. Brands listed on this page are ranked in the top twenty within the market and product category by total retail sales volume.

