.svg)

Sep-2026
Sales
Trend
6-Month
Product Count
SKUs
Avg Price
YoY Sales Change
YoY Price Change


Market Insights Snapshot
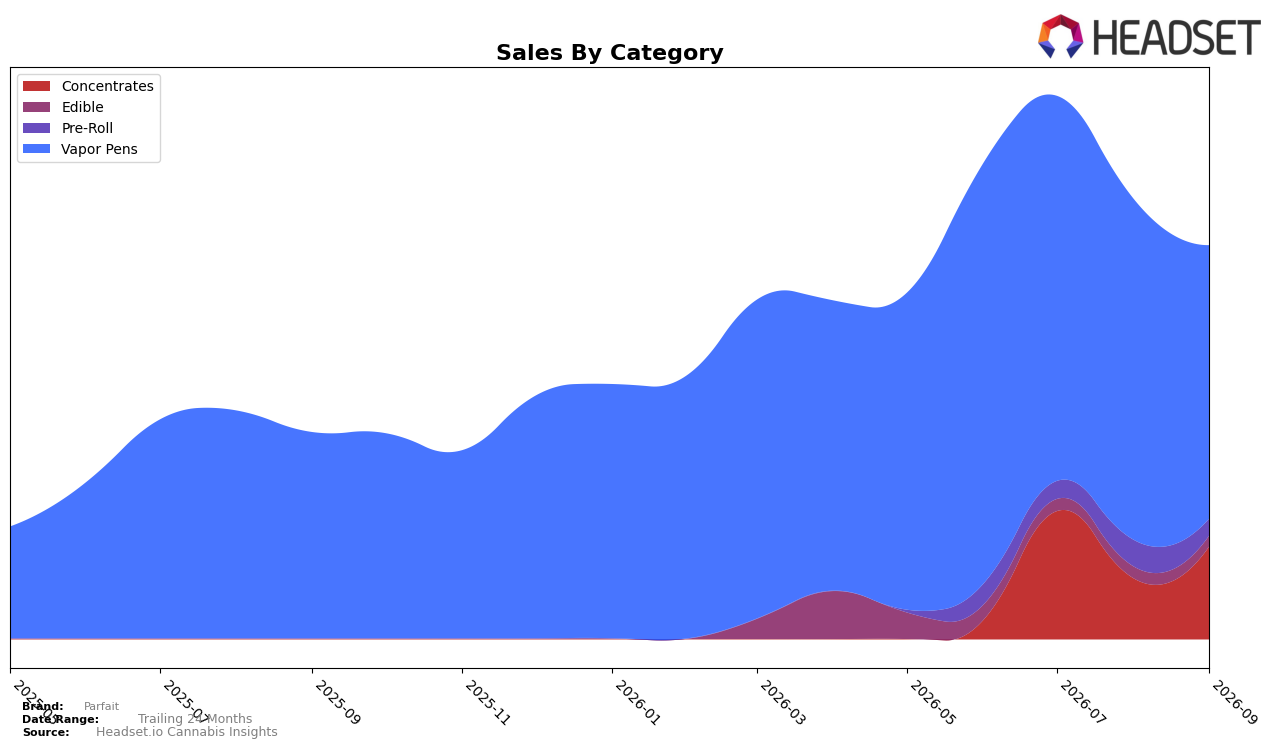
Parfait concentrated 69.49% of September 2026 sales in Vapor Pens, where year-over-year growth was 32.60% but month-over-month declined 19.96%, while Concentrates rose to 23.64% share with a 52.22% month-over-month increase and no year-over-year baseline. Pre-Roll slipped to 4.20% share with a 37.03% month-over-month drop, and Edible held 2.67% share with an 8.99% month-over-month decline; alongside this mix, the brand’s average price fell 30.62% year-over-year and overall brand sales rose 90.82% year-over-year. The pattern implies Parfait is pivoting toward a two-pillar mix of Vapor Pens and Concentrates, using lower prices in core SKUs while leaning into Concentrates for incremental volume to offset a short-term Vapor Pens pullback.
In Massachusetts Vapor Pens, Parfait sat at rank 100 in September 2026 while Vapor Pens carried 69.49% of brand sales and posted a 19.96% month-over-month decline, indicating limited shelf velocity in its anchor category; meanwhile, the 52.22% month-over-month gain in Concentrates to 23.64% share points to distribution or SKU activation that is outpacing legacy formats. With brand sales up 90.82% year-over-year but the flagship category down month-over-month, the mix shift signals a positioning move toward value-led entry in pens (supported by a 30.62% year-over-year price decrease) and premiumized Concentrates that can capture higher basket roles despite a smaller base.
Competitive Landscape
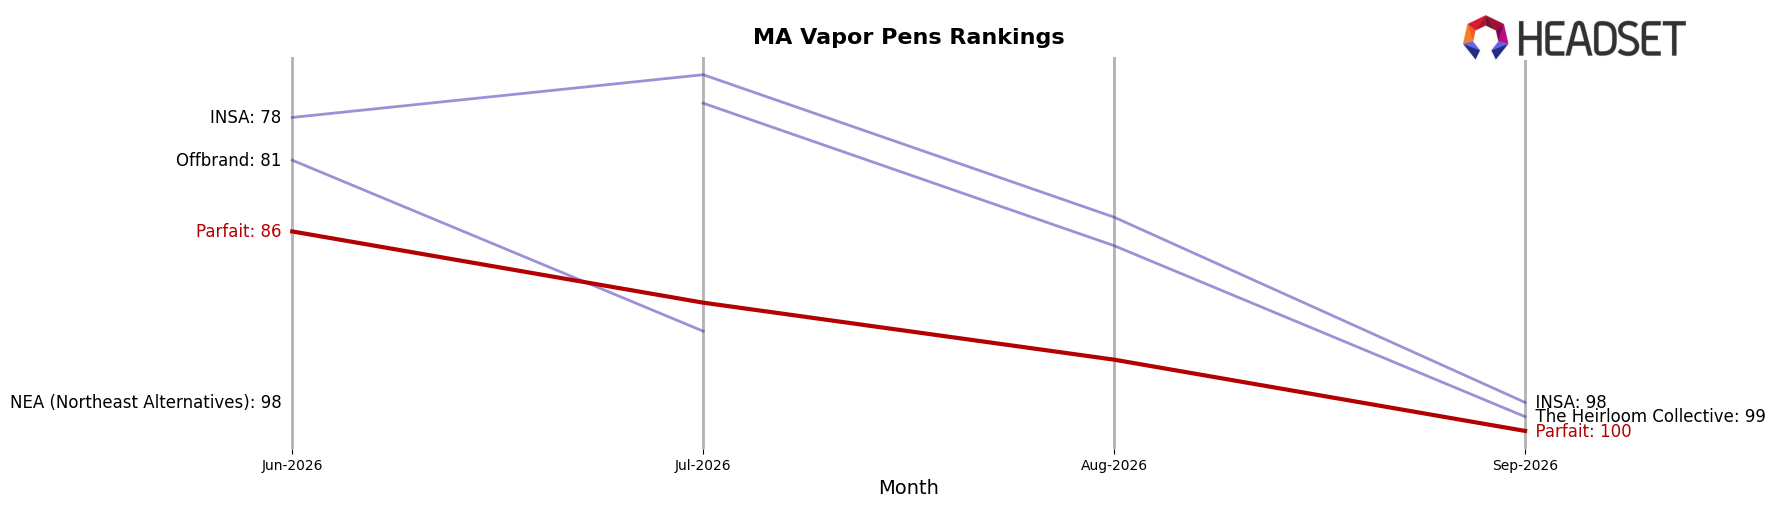
Parfait sits at rank #100 in Massachusetts Vapor Pens in September 2026, a 1-place improvement from #101 year over year, but down 14 spots from its June 2026 peak at #86; this trajectory contrasts with Fernway, which held #1 both year over year and in September 2026 while growing sales 43.6%, and Jeeter, which climbed from #23 to #4 alongside a 421.5% sales increase. With Select remaining #2 year over year and in September 2026 despite an 11.7% sales decline, the category is rewarding rapid movers, and Parfait’s slip from #86 to #100 over three months implies share is consolidating toward leaders and that incremental rank gains year over year are not translating into sustained placement.
Notable Products
The steepest decline sets the tone: Lemon Cured Resin Cartridge (1g) fell 46.7% month over month to rank 3, while Strawberry Infused Pre-Roll (1g) dropped 40.4% at rank 5, signaling a pullback in two previously active formats. In contrast, Peach Cured Resin Cartridge (1g) gained 9.1% to hold rank 1 and Pineapple Cured Resin Cartridge (1g) rose 11.3% at rank 2, and Vapor Pens occupy three of the top ten positions despite the Lemon Cartridge contraction. This mix — Vapor Pens concentrated in multiple top slots alongside double-digit Pre-Roll declines — implies Parfait is consolidating demand around cured resin inhalables rather than combustion-based offerings, with pricing headroom limited to a single cited $9,494 anchor on the leading SKU.
Top Selling Cannabis Brands






Data for this report comes from real-time sales reporting by participating cannabis retailers via their point-of-sale systems, which are linked up with Headset’s business intelligence software. Headset’s data is very reliable, as it comes digitally direct from our partner retailers. However, the potential does exist for misreporting in the instance of duplicates, incorrectly classified products, inaccurate entry of products into point-of-sale systems, or even simple human error at the point of purchase. Thus, there is a slight margin of error to consider. Brands listed on this page are ranked in the top twenty within the market and product category by total retail sales volume.

