.svg)


Where to Buy
Rec Roots is stocked at 69 licensed dispensaries across New York, with the deepest coverage in New York, Staten Island, Brooklyn, Rochester, and Queens. Search by ZIP code or city below to find the closest one, or filter by product type if you are after a specific format.
Market Insights Snapshot
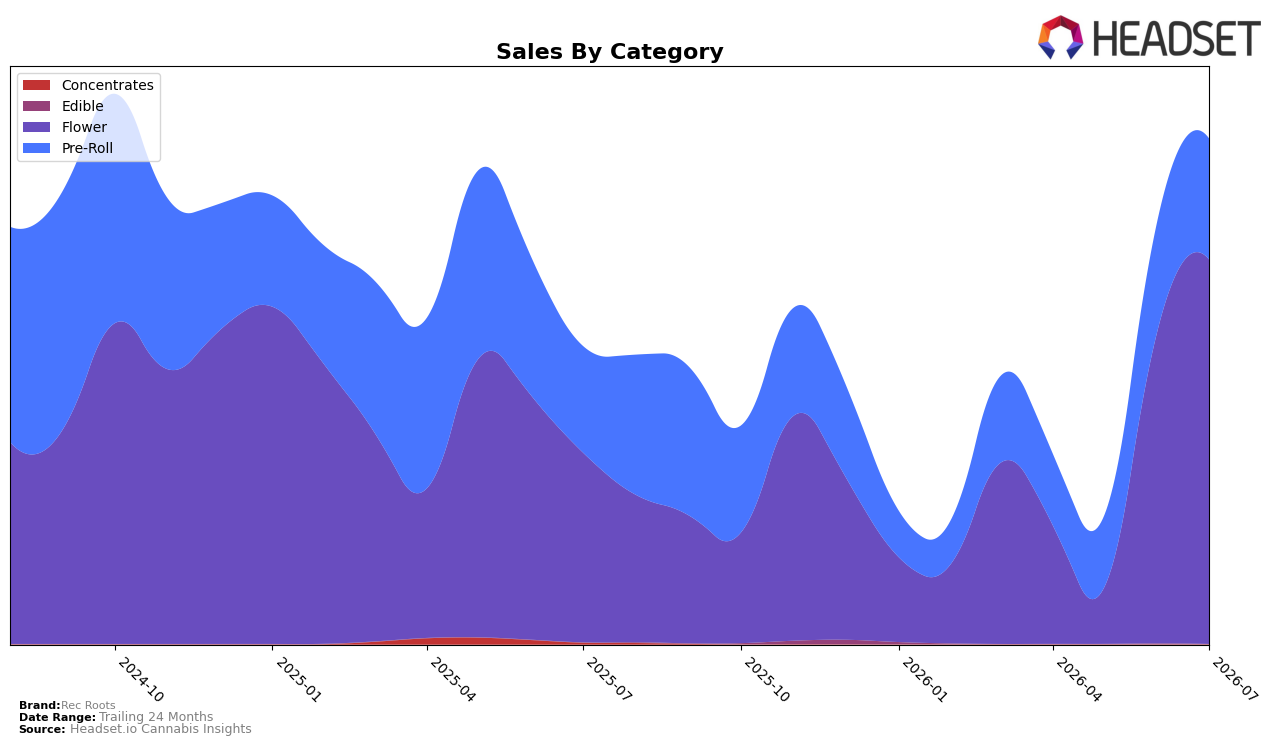
In July 2026, Rec Roots leaned further into Flower, which held a 76.09% mix share and expanded 22.73% month over month and 102.82% year over year, while Pre-Roll at 23.91% share rose 9.53% MoM and 13.58% YoY. The brand’s average price increased 17.28% YoY to $25.24, alongside a 69.79% YoY lift in total brand sales, signaling that unit growth outpaced price inflation as Flower’s mix deepened. This skew coincides with a Flower rank of 46 in New York and a top-category pricing at $44.84, implying Rec Roots is extracting more value from Flower even as Pre-Roll contributes slower growth. The pattern implies Rec Roots is compounding growth through a heavier Flower allocation where price and velocity are both rising, rather than relying on broad-based category gains.
The shift toward a 76.09% Flower mix, paired with a 22.73% MoM surge versus Pre-Roll’s 9.53% MoM, suggests Rec Roots is consolidating around its highest-momentum category to amplify near-term share capture. With Flower up 102.82% YoY versus Pre-Roll up 13.58% YoY and the overall brand up 69.79% YoY, the brand’s positioning tilts toward premium-throughput Flower, where higher average item prices at $44.84 can sustain margin while scale builds. Holding rank 46 in New York Flower while expanding mix indicates room to trade rank positions upward as distribution and assortment emphasize Flower, implying the strategy prioritizes depth in a single category over diversification to maintain velocity and price realization.
Competitive Landscape
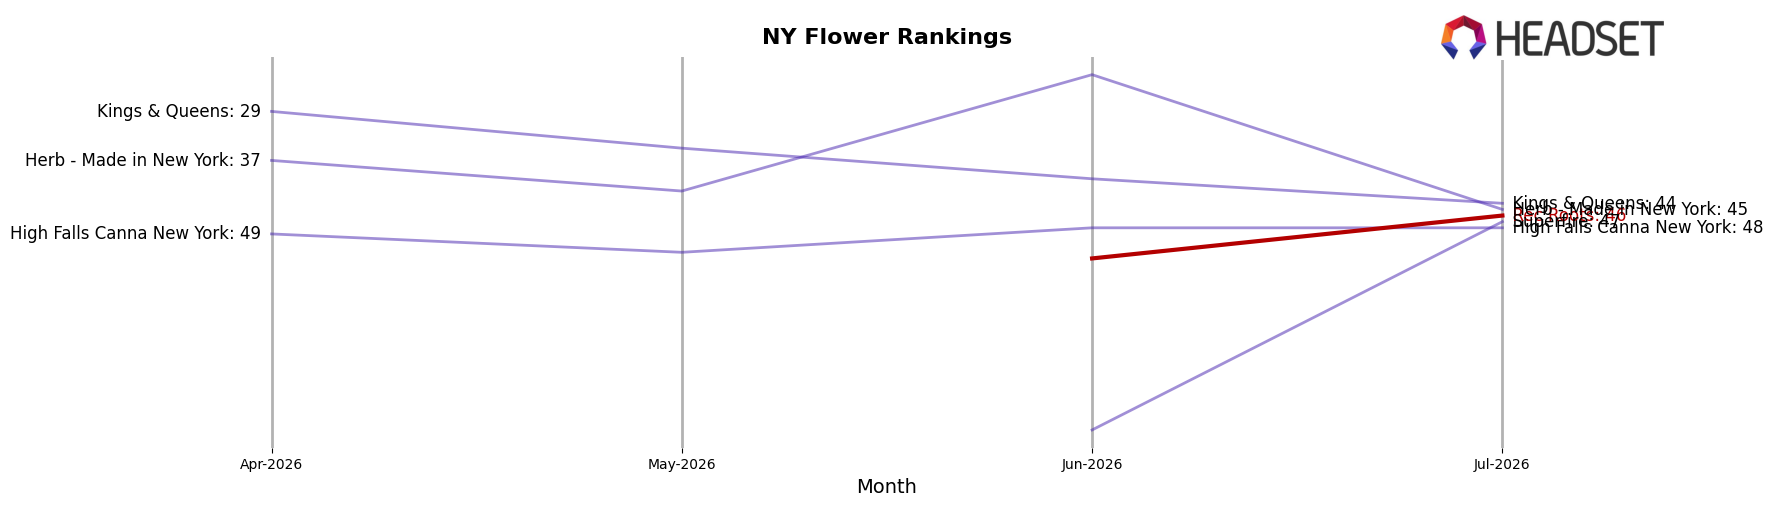
Rec Roots sits at rank #46 in New York Flower for July 2026, improving 27 positions year over year from #73 and jumping 60 spots since April 2026 when it was #106; despite that momentum, it remains 12 places below its peak at #34 from January 2025. In contrast, Find. climbed from #8 to #1 while growing sales 46.7%, and Grassroots advanced from #15 to #5 with 79.8% sales growth, indicating leaders are converting rank gains into higher velocity while Rec Roots’ mid-pack rise has yet to close the gap. The pattern implies Rec Roots’ trajectory is upward but still transitional, with recent rank acceleration outpacing its year-over-year change but lagging category front-runners that combined rank lifts with larger share capture.
Notable Products
Animal Tsunami Pre-Roll (1g) posted the standout move in July 2026 with a 93.8% month-over-month surge, jumping into rank 4, while NYC Diesel x Endgame Pre-Roll (1g) climbed 48.5% to rank 2 and White Truffle Pre-Roll (1g) advanced 23.3% to rank 1. With six of the top ten SKUs in Pre-Roll, the category concentration alongside a Flower riser like Triple Burger (3.5g) at +61.8% and rank 7 signals a tilt toward quick-turn inhalables backed by a single Flower momentum play. The presence of two Flower SKUs above $10,000 in July 2026 sales, including Triple Burger (3.5g) at $19,296 and Super Lemon Haze (3.5g) at rank 10, alongside rank 1 and rank 2 Pre-Rolls, suggests Rec Roots is converting trial in Pre-Roll into higher-ticket Flower baskets. The pattern implies Rec Roots is leaning into Pre-Roll-led acquisition while selectively elevating a few Flower strains to capture trade-up, optimizing for velocity at the top and margin mix in mid ranks.
Top Selling Cannabis Brands






Data for this report comes from real-time sales reporting by participating cannabis retailers via their point-of-sale systems, which are linked up with Headset’s business intelligence software. Headset’s data is very reliable, as it comes digitally direct from our partner retailers. However, the potential does exist for misreporting in the instance of duplicates, incorrectly classified products, inaccurate entry of products into point-of-sale systems, or even simple human error at the point of purchase. Thus, there is a slight margin of error to consider. Brands listed on this page are ranked in the top twenty within the market and product category by total retail sales volume.

