.svg)
Aug-2026
Sales
Trend
6-Month
Product Count
SKUs
Avg Price
YoY Sales Change
YoY Price Change


Market Insights Snapshot
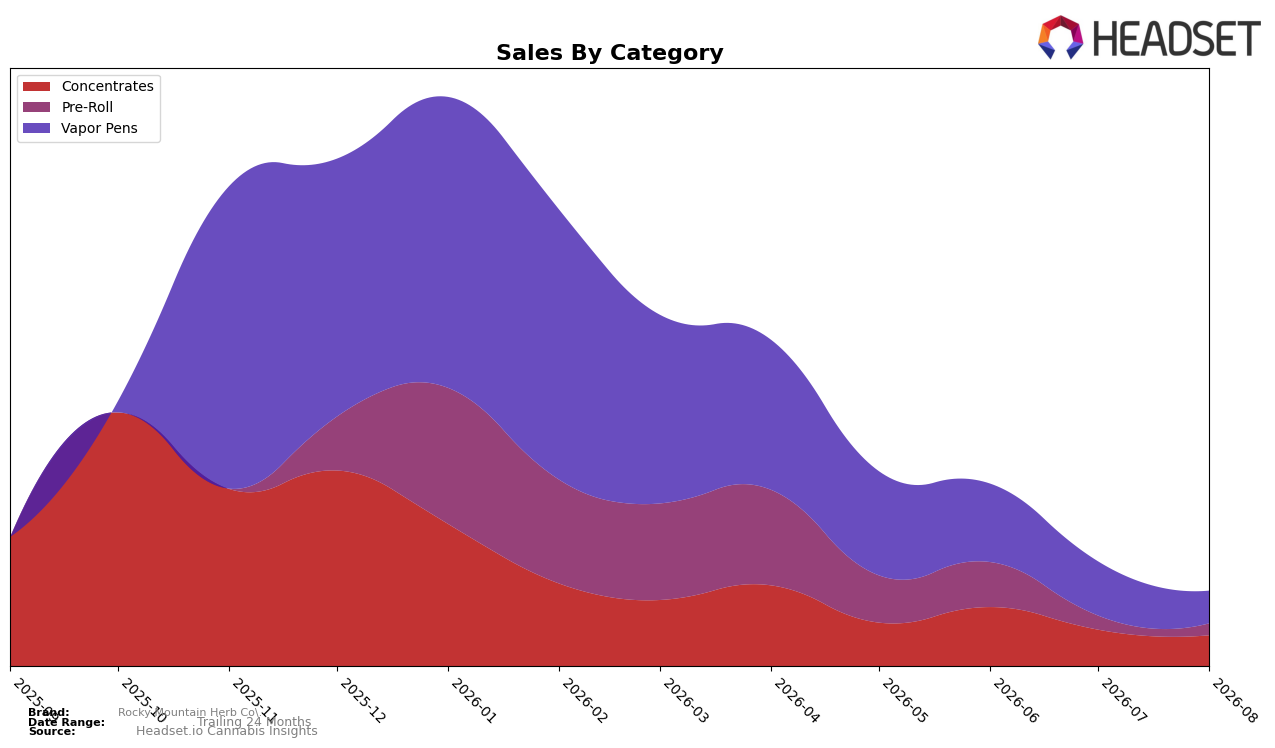
In August 2026, Rocky Mountain Herb Co. concentrated revenue in two categories: Vapor Pens at 43.34% share and Concentrates at 41.11%, with Pre-Roll contributing 15.54%. Month over month, Vapor Pens fell 39.90% while Concentrates declined 15.58%, and Pre-Roll slipped 16.27%, shifting the mix marginally toward Concentrates despite broad contraction. Average prices diverged by category — $36.26 in Vapor Pens versus $32.24 in Concentrates and $33.19 in Pre-Roll — indicating higher ticket sizes where the steepest volume pullback occurred, which implies August 2026 mix pressure came more from rate-sensitive Vapor Pen buyers than from Concentrates or Pre-Roll.
The tilt toward Concentrates at 41.11% share alongside a 15.58% month-over-month decline, versus a 39.90% drop in Vapor Pens, positions Rocky Mountain Herb Co. to lean into categories with relatively steadier month-to-month retention. With Alberta as the top province and Concentrates as the top category, the brand’s pricing corridor near $32–$36 suggests room to defend the Concentrates base while recalibrating Vapor Pen assortment to mitigate volatility, implying a near-term positioning pivot toward Concentrates-led stability with Pre-Roll as a secondary buffer given its smaller 15.54% share and 16.27% decline.
Competitive Landscape
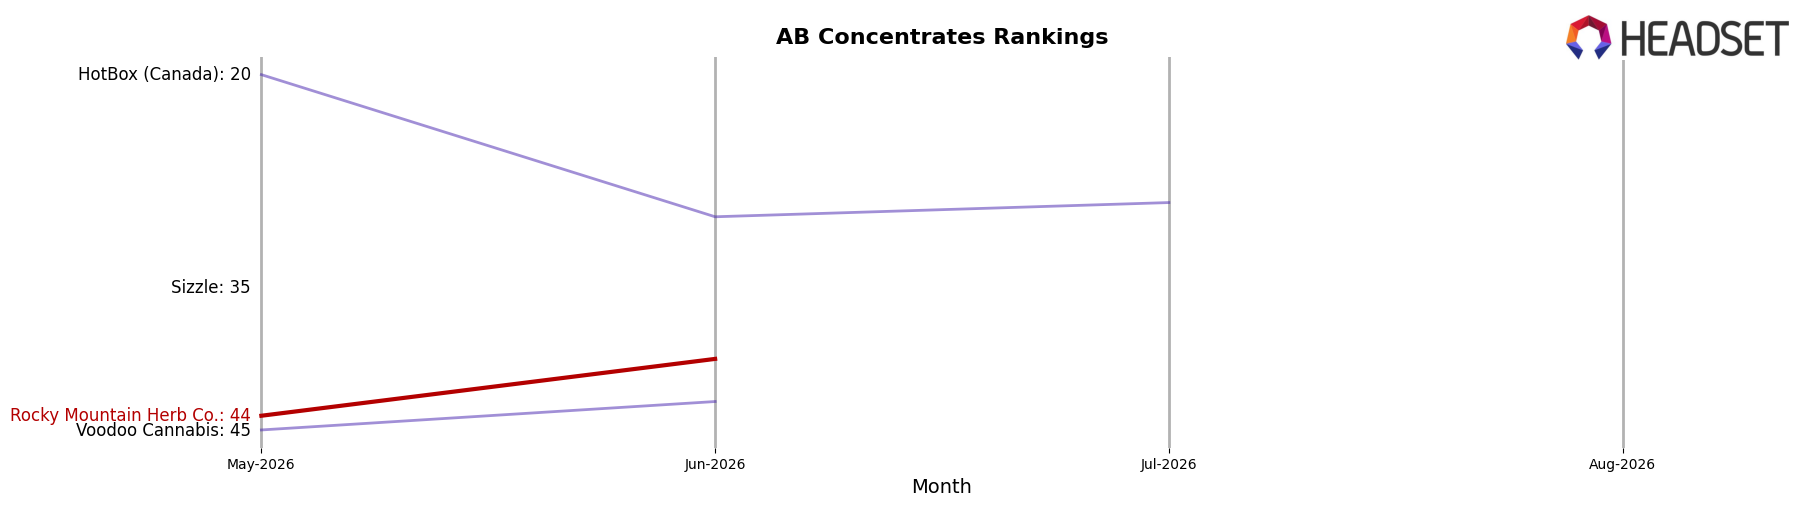
Rocky Mountain Herb Co. sits at rank #44 in AB Concentrates, a 1-position improvement from #45 three months ago, but down from a peak of #16 in October 2025; meanwhile, category leaders moved differently, with BoxHot holding #1 while posting a -2.6% YoY sales change and Sticky Greens vaulting to #5 from #49 YoY with 1486.7% sales growth, indicating that Rocky Mountain Herb Co.’s marginal quarter-over-quarter rank gain contrasts with rapid share reallocation toward faster movers and implies a stabilization phase rather than a return to last year’s top-20 trajectory.
Notable Products
Peach Lemonade Infused Pre-Roll 3-Pack (1.35g) posted the largest move with a 225.7% month-over-month surge to $772 and climbed into rank 6, while Animal RNTZ Shatter (1g) plunged 69.5% and slid to rank 4. Fire Breath Shatter (1g) led the lineup at rank 1 with a 20.1% gain, as Liquid Imagination Solventless Liquid Diamond Cartridge (1g) fell 23.0% to rank 2. The pattern implies Rocky Mountain Herb Co. is shifting mix toward value-seeking impulse formats even as premium vapor pens retrench.
Top Selling Cannabis Brands






Data for this report comes from real-time sales reporting by participating cannabis retailers via their point-of-sale systems, which are linked up with Headset’s business intelligence software. Headset’s data is very reliable, as it comes digitally direct from our partner retailers. However, the potential does exist for misreporting in the instance of duplicates, incorrectly classified products, inaccurate entry of products into point-of-sale systems, or even simple human error at the point of purchase. Thus, there is a slight margin of error to consider. Brands listed on this page are ranked in the top twenty within the market and product category by total retail sales volume.

