.svg)


Where to Buy
SPCY is stocked at 17 licensed dispensaries across Colorado, with the deepest coverage in Denver, Boulder, Fort Collins, Sheridan, and Aurora. Search by ZIP code or city below to find the closest one, or filter by product type if you are after a specific format.
Market Insights Snapshot
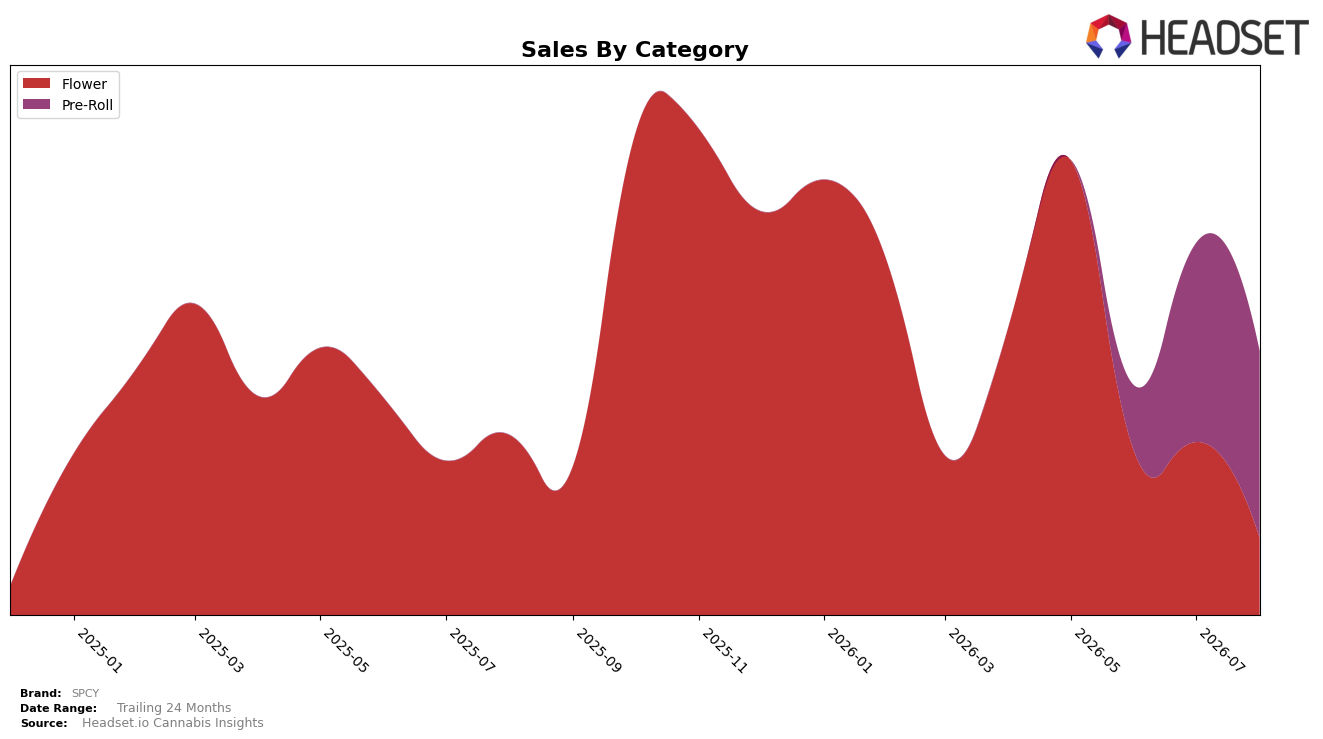
In August 2026, SPCY’s mix tilted heavily to Pre-Roll at 70.74% share while Flower accounted for 29.26%, with Pre-Roll down 6.06% month over month and Flower plunging 55.38% month over month; against year over year, Flower contracted 57.13% while Pre-Roll carried no reported year-over-year figure. Despite overall brand sales rising 46.53% year over year, the average price fell 59.74% year over year to $9.30, and within the mix, Pre-Roll priced at $7.31 versus Flower at $27.00, indicating volume migration into lower-price units; the pattern implies SPCY is consolidating around value-driven Pre-Rolls while de-emphasizing higher-ticket Flower to sustain throughput.
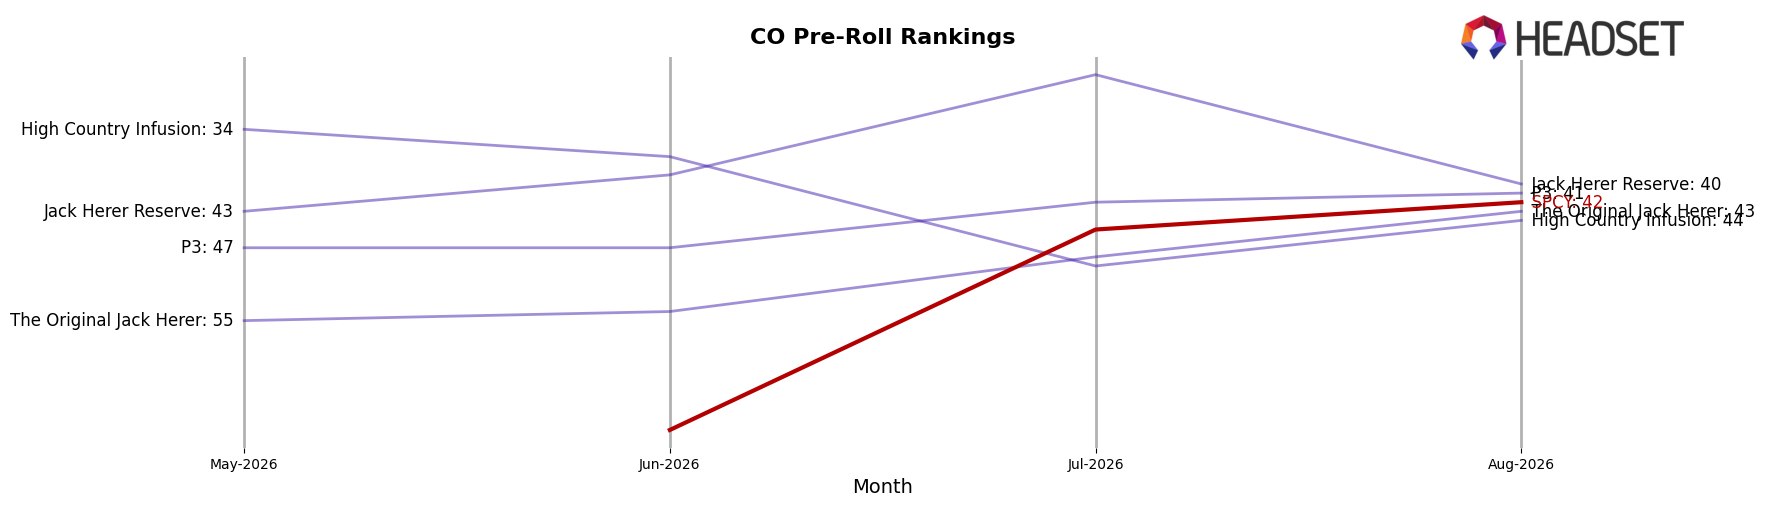
Positionally, SPCY sits at rank 42 in Pre-Roll in Colorado, and the 6.06% month-over-month dip in its anchor category coupled with a 55.38% month-over-month collapse in Flower suggests the brand is trading rank stability for margin pressure via mix and price. With Pre-Roll holding 70.74% share and Flower at 29.26% alongside a 59.74% year-over-year price compression, SPCY’s path forward implies a scale-first stance in Pre-Rolls to defend or improve category rank while accepting reduced average revenue per unit; the thesis is that further share gains will likely require operational efficiency rather than price recovery.
Competitive Landscape
SPCY ranks #42 in Colorado Pre-Roll in August 2026, with no recorded year-over-year rank to compare, and its peak rank is also #42 in August 2026, indicating a recent entry or re-entry at the lower end of the table. Meanwhile, Green Label Cannabis held #1 both this year and last year despite a 30% year-over-year sales decline, and Be One Kind vaulted from #28 to #5 with a 293% year-over-year sales increase, contrasting SPCY’s static position. Cali-Blaze climbed from #3 to #2 alongside a 19.7% sales lift while Kaviar slipped from #2 to #4 with a 41.5% sales drop, signaling churn in the top tier that SPCY has not yet capitalized on. The pattern implies SPCY’s current rank trajectory represents a baseline starting point rather than upward momentum, and near-term share gains will depend on converting top-tier volatility into incremental rank advances.
Notable Products
Logan's Run Pre-Roll (1g) posted the steepest movement in August 2026 with a -57.97% month-over-month drop at rank 8, while Slazerbeam Pre-Roll (1g) also fell -52.72% at rank 4, indicating sharp volatility concentrated in mid-table pre-rolls. Countering that, Gold Mintz (Bulk) surged +66.41% to rank 7 and Platinum Durban Pre-Roll (1g) rose +59.63% at rank 6, creating a split where gains sit just outside the top five while the top four saw double-digit declines including Root Beer Runtz Pre-Roll (1g) at rank 1 down -25.89%. With eight of the top ten positioned in the Pre-Roll category and only one Flower SKU in the top eight delivering the largest gain, the mix tilts toward defending pre-roll share while bulk flower momentum introduces a parallel growth lane that could rebalance portfolio emphasis.
Top Selling Cannabis Brands






Data for this report comes from real-time sales reporting by participating cannabis retailers via their point-of-sale systems, which are linked up with Headset’s business intelligence software. Headset’s data is very reliable, as it comes digitally direct from our partner retailers. However, the potential does exist for misreporting in the instance of duplicates, incorrectly classified products, inaccurate entry of products into point-of-sale systems, or even simple human error at the point of purchase. Thus, there is a slight margin of error to consider. Brands listed on this page are ranked in the top twenty within the market and product category by total retail sales volume.

