.svg)

Aug-2026
Sales
Trend
6-Month
Product Count
SKUs
Avg Price
YoY Sales Change
YoY Price Change


Where to Buy
Static Room is stocked at 23 licensed dispensaries across New York, with the deepest coverage in New York, Brooklyn, Staten Island, Mount Vernon, and Peekskill. Search by ZIP code or city below to find the closest one, or filter by product type if you are after a specific format.
Market Insights Snapshot
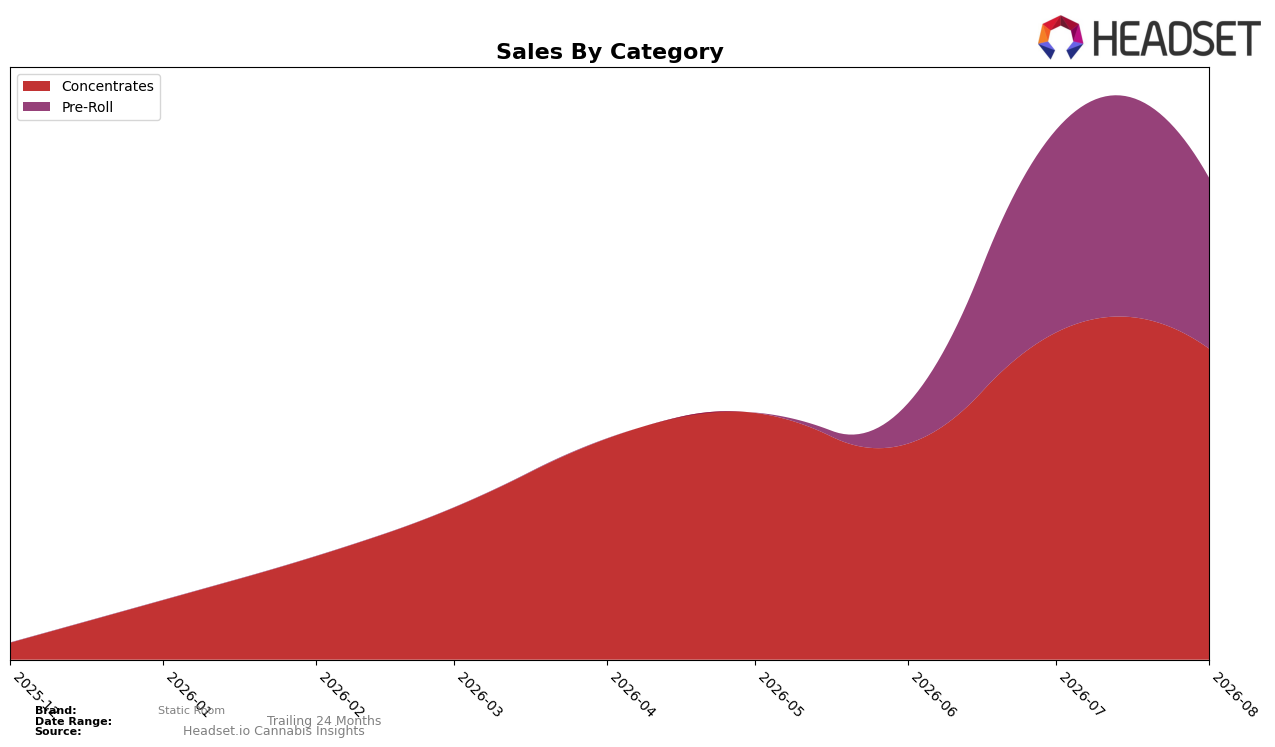
In August 2026, Static Room concentrated 64.56% of sales in Concentrates and 35.44% in Pre-Roll, while the Concentrates share faced a month-over-month decline of 4.96% and Pre-Roll contracted faster at 15.71% MoM. The Concentrates average price at $64.24 sat just below the Pre-Roll average price of $64.73, and Concentrates held rank 29 in New York for its category, reinforcing a heavier tilt toward that segment. The pattern implies the brand’s volume is anchored in Concentrates with pricing parity across forms, but recent MoM softness — sharper in Pre-Roll by 10.75 percentage points — suggests reliance on Concentrates for stability while Pre-Roll acts as a volatile secondary lever.
With Concentrates at 64.56% share and rank 29 in New York, the brand’s position hinges on defending mid-pack visibility where small share shifts can move rank meaningfully, and the 4.96% MoM decline versus a 15.71% MoM drop in Pre-Roll points to a need to prioritize Concentrates efficiency over chasing Pre-Roll recovery. The near-equal average prices ($64.24 vs. $64.73) remove price as a differentiator, so the 10.75 percentage-point gap in MoM declines and the 29th-place anchor in a single core category imply Static Room’s path to improved placement runs through mix concentration and SKU productivity in Concentrates rather than breadth expansion in Pre-Roll.
Competitive Landscape
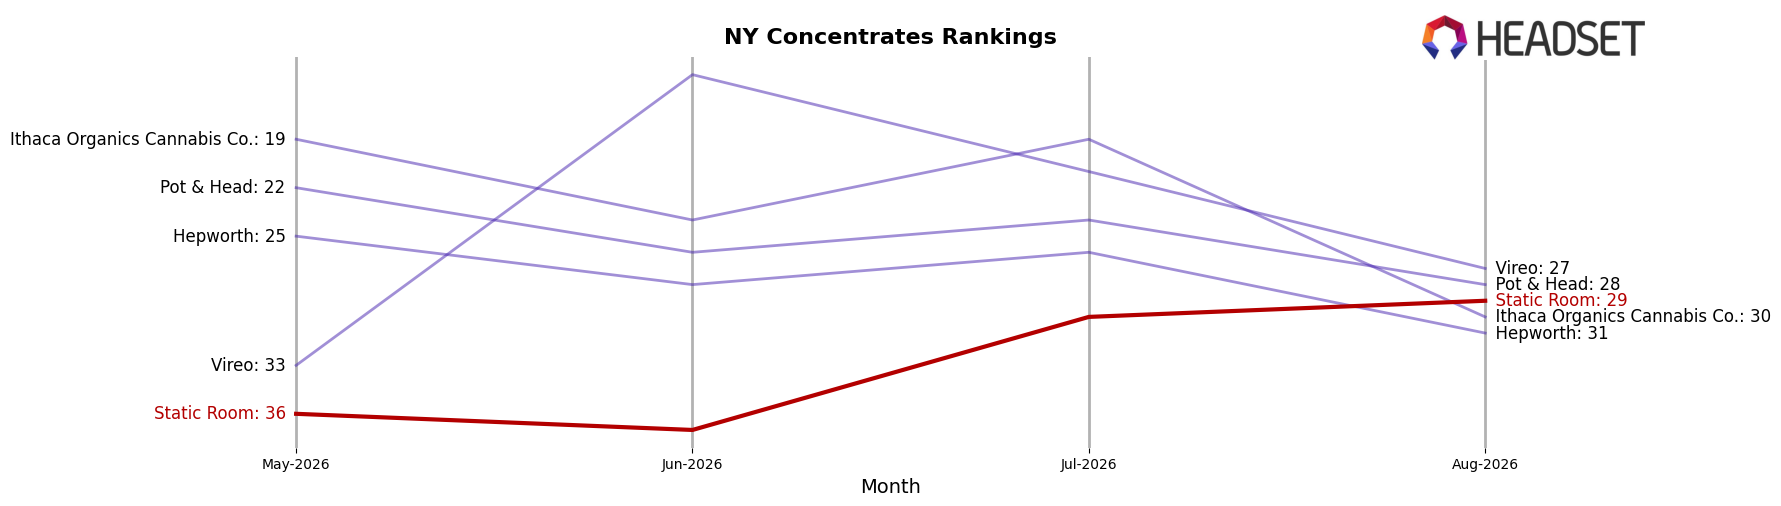
Static Room sits at rank #29 in NY Concentrates in August 2026, a climb of 7 positions from rank #36 in May 2026, and matching its peak rank of #29 in August 2026, while year-over-year rank is unavailable. In contrast, Mfny (Marijuana Farms New York) held steady at #1 year-over-year (from #1 to #1) with sales up 42.4%, and UMAMII surged from #33 to #3 with a 3,294.5% sales increase, indicating faster upward mobility among leaders than mid-pack brands. The directional pattern—Static Room improving 7 ranks quarter-over-quarter while top competitors either hold #1 or jump 30 ranks—implies that Static Room’s recent ascent is real but insufficient to close the competitive distance without an acceleration in share-capturing tactics.
Notable Products
Churroz - Party Popperz x Tropicana Cherry Hash Infused Pre-Roll (2g) led the month’s movement with a -21.5% MoM drop while holding rank 5, and Lemon Popperz X Honey Banana Hash Infused Pre-Roll (2g) fell -22.4% at a tied rank 5, signaling Pre-Rolls lost momentum as Mega Z Red x Stardust #36 Infused Pre-Roll (2g) climbed +51.3% to rank 7. In contrast, Strawberry Sorbet Sift Hash (1g) rose +16.0% at rank 2 while GMO Static Sift Hash (1g) slipped -2.4% but stayed at rank 1, and four of the top ten are Concentrates which outperformed Pre-Rolls on average in August 2026. Tropicana Cherry Sift Hash (1g) fell -43.0% at rank 8 and Wedding Crashers Static Sift Hash (1g) declined -32.3% at rank 9 even as Grease Monkey Sorbet Hash (1g) increased +11.7% at rank 4, with concentrates still contributing the single largest SKU by rank despite mixed MoM swings. The mix points to Static Room prioritizing premium concentrates as the anchor while treating infused Pre-Rolls as opportunistic volume plays that are sensitive to promotional cadence and flavor rotation, supported by mid-pack growth and one high-variance gainer against multiple double-digit decliners and a single-dollar figure of $3,383 for GMO Static Sift Hash (1g) anchoring the top rank.
Top Selling Cannabis Brands






Data for this report comes from real-time sales reporting by participating cannabis retailers via their point-of-sale systems, which are linked up with Headset’s business intelligence software. Headset’s data is very reliable, as it comes digitally direct from our partner retailers. However, the potential does exist for misreporting in the instance of duplicates, incorrectly classified products, inaccurate entry of products into point-of-sale systems, or even simple human error at the point of purchase. Thus, there is a slight margin of error to consider. Brands listed on this page are ranked in the top twenty within the market and product category by total retail sales volume.

