.svg)

Aug-2026
Sales
Trend
6-Month
Product Count
SKUs
Avg Price
YoY Sales Change
YoY Price Change


Where to Buy
Stellar Solventless is stocked at 30 licensed dispensaries across Missouri, with the deepest coverage in Kansas City, Columbia, O'Fallon, Blue Springs, and Branson. Search by ZIP code or city below to find the closest one, or filter by product type if you are after a specific format.
Market Insights Snapshot
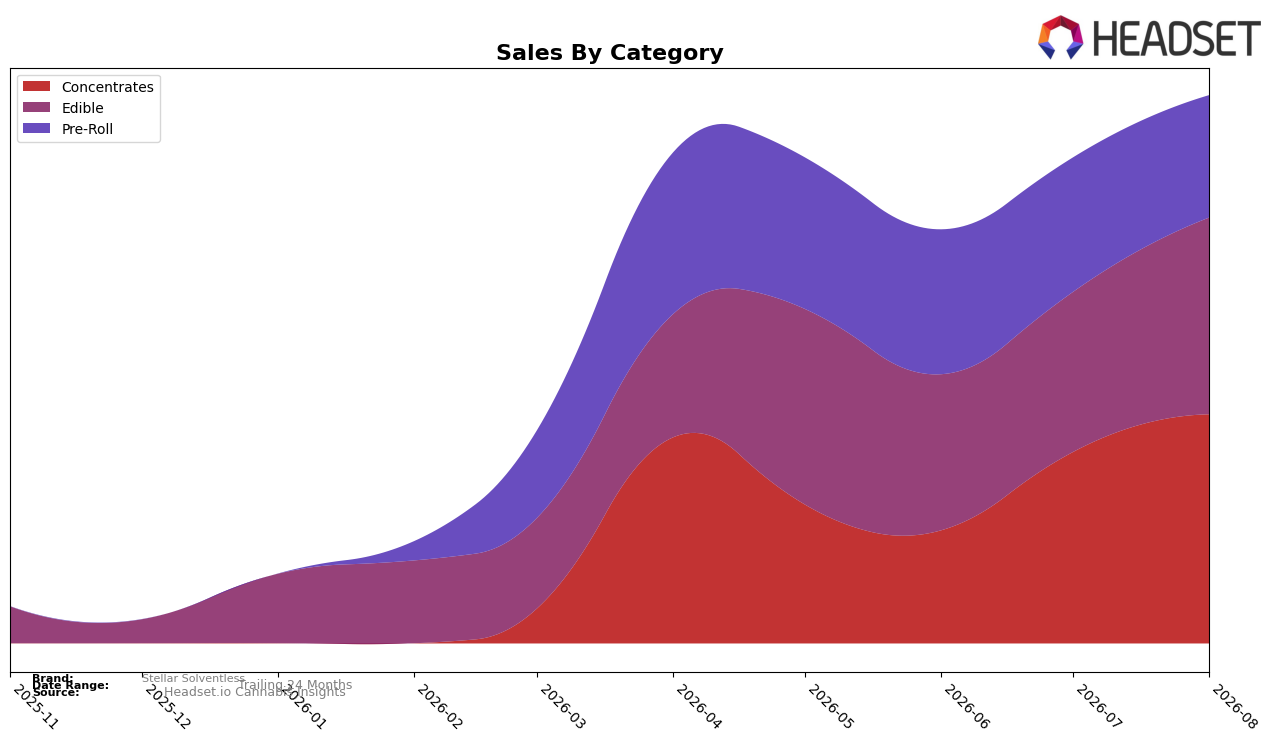
In August 2026, Stellar Solventless concentrated its mix around Concentrates at 41.80% share (ranked 30th in Missouri Concentrates), while Edible held 35.87% share and Pre-Roll accounted for 22.32% share. Month over month, Concentrates expanded by 19.73% and Edible rose by 22.92%, while Pre-Roll declined by 8.98%; average item prices sat at $44.71 for Concentrates and $22.98 for Edible, versus $15.84 for Pre-Roll. The pattern implies a pivot toward higher-value formats as growth concentrates in two categories that together now represent 77.67% of sales, with rank 30 signaling room to translate mix momentum into category standing.
The acceleration in Concentrates at 19.73% MoM alongside a 22.92% MoM lift in Edible, against a 8.98% MoM drop in Pre-Roll, implies resource allocation should tilt toward premium extraction and ingestible SKUs where price points of $44.71 and $22.98 can support margin, rather than chasing volume in a softer Pre-Roll segment at $15.84. With Concentrates already at 41.80% share and Edible nearing parity at 35.87%, maintaining depth in these lanes can help elevate the Concentrates rank beyond 30 in Missouri, while the Pre-Roll drag at 22.32% share suggests pruning or repositioning to prevent mix dilution.
Competitive Landscape
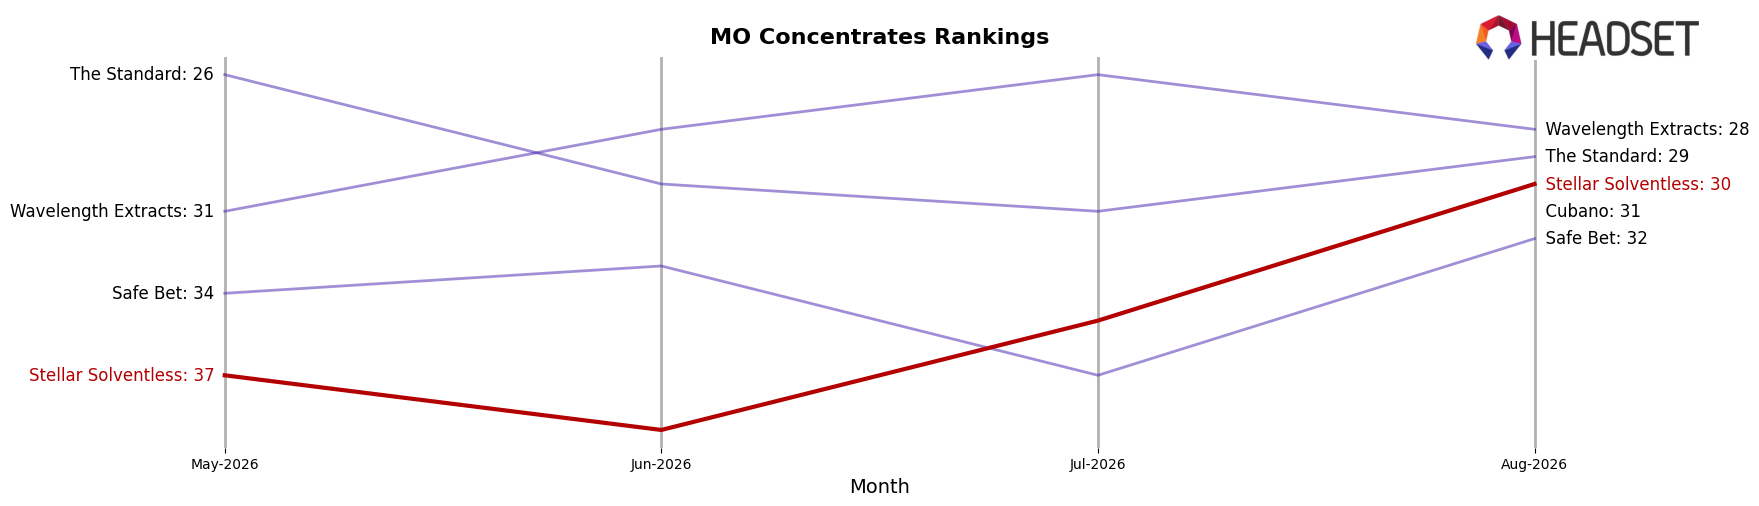
Stellar Solventless sits at rank #30 in MO Concentrates in August 2026, improving 7 positions from #37 in May 2026 and marking a new peak at #30 in August 2026; the lack of a year-over-year rank baseline limits direct annual comparison, but the three-month climb of 19% in rank position (from 37 to 30) signals momentum. By contrast, Vibe Cannabis (MO) holds #1 after staying flat year over year at #1 while growing sales 21.3% YoY, and Proper Cannabis moved up from #3 to #2 as Elevate slid from #2 to #4 with a 39.5% YoY sales decline; Head Change edged from #7 to #5 despite a 2.2% YoY sales dip. The pattern implies Stellar Solventless is progressing into the competitive mid-tier, with recent rank gains suggesting share capture from brands experiencing downward pressure at the top.
Notable Products
Moroccan Peaches Solventless Gummies 10-Pack (300mg) delivered the standout move in August 2026 with a +78.2% month-over-month surge, taking rank 1, while Hash x Rosin Infused Pre-Roll (1g) slid -28.9% to rank 4. Sour Raspberry Solventless Gummies 10-Pack (300mg) climbed +50.0% to rank 3 and Hazel Creek Haze Aged Full Melt X Live Hash Rosin Infused Pre-Roll (1g) rose +41.5% at rank 8, contrasting with Devils Lunch Hash Rosin Infused Pre-Roll (1g) declining -30.1% at rank 6. Four of the top ten are Edible SKUs, with Watermelon Solventless Gummies 10-Pack (300mg) inching +2.3% at rank 5 and Sour Apple Solventless Gummies 10-Pack (300mg) dipping -9.1% at rank 7, indicating gummies are consolidating share even as pre-roll volatility increases. The pattern implies Stellar Solventless is tilting toward higher-velocity Edibles while reevaluating infused pre-roll depth as variance widens across positions 2 through 8 and a single Concentrates SKU at rank 9 contributes incremental revenue near $6,571.
Top Selling Cannabis Brands






Data for this report comes from real-time sales reporting by participating cannabis retailers via their point-of-sale systems, which are linked up with Headset’s business intelligence software. Headset’s data is very reliable, as it comes digitally direct from our partner retailers. However, the potential does exist for misreporting in the instance of duplicates, incorrectly classified products, inaccurate entry of products into point-of-sale systems, or even simple human error at the point of purchase. Thus, there is a slight margin of error to consider. Brands listed on this page are ranked in the top twenty within the market and product category by total retail sales volume.

