.svg)
Aug-2026
Sales
Trend
6-Month
Product Count
SKUs
Avg Price
YoY Sales Change
YoY Price Change


Market Insights Snapshot
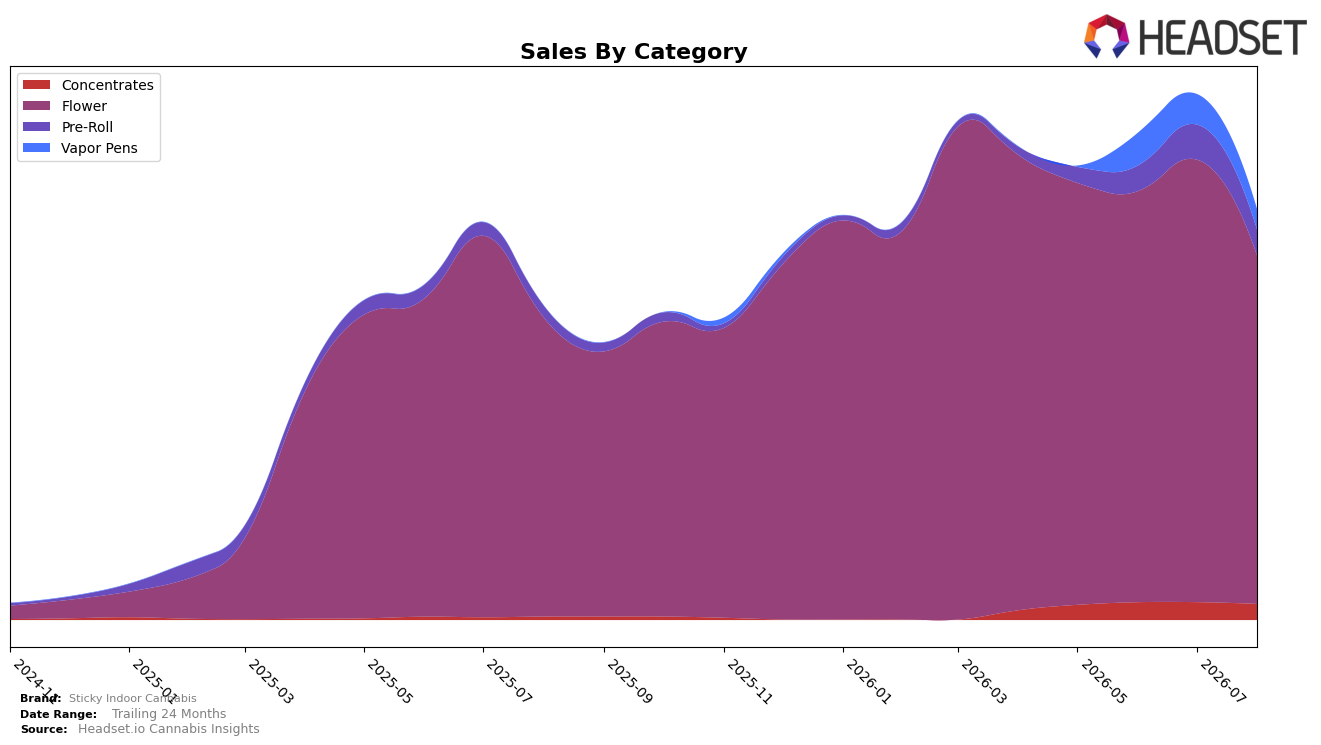
In August 2026, Sticky Indoor Cannabis concentrated 85.03% of sales in Flower with a year-over-year change of 16.24% and a month-over-month decline of 21.46%, while Pre-Roll held 6.23% share with 124.55% year-over-year growth and a 26.50% month-over-month drop. Vapor Pens accounted for 4.91% share with a 33.55% month-over-month decline and no year-over-year baseline, and Concentrates reached 3.83% share with 416.79% year-over-year growth but a 10.15% month-over-month dip; alongside this mix, average price fell 7.62% year-over-year to $20.10 even as brand-level sales rose 30.44% year-over-year. The pattern implies a portfolio reliant on Flower for scale yet increasingly levered to smaller formats for growth, with August 2026’s across-the-board month-over-month pullback indicating exposure to seasonal or promotional cadence rather than category abandonment.
Given an 85.03% Flower share alongside a 16.24% year-over-year gain and a 21.46% month-over-month decline, the brand’s positioning hinges on maintaining Flower velocity while using Pre-Roll’s 124.55% year-over-year surge and Concentrates’ 416.79% year-over-year expansion to diversify risk. With a 33.55% month-over-month decline in Vapor Pens and a 10.15% month-over-month decline in Concentrates, plus a 7.62% year-over-year price decrease tied to a 30.44% year-over-year sales increase, the mix signals a value-forward stance that trades price for volume, implying headroom to stabilize non-Flower formats to lift rank in California while sustaining Flower scale at rank 45.
Competitive Landscape
Sticky Indoor Cannabis sits at rank #45 in California Flower in August 2026, improving 16 positions from #61 year over year, but softening 2 spots from #43 since May 2026 while remaining 9 ranks below its March 2026 peak at #36; in contrast, STIIIZY rose from #2 to #1 with a 50.4% year-over-year sales increase and CAM climbed from #3 to #2 with 46.6% growth as CannaBiotix (CBX) slipped from #1 to #3 on a -16.0% decline; this mix of a 16-rank annual gain alongside a 2-rank recent dip implies Sticky Indoor Cannabis is on a gradual recovery trajectory that risks stalling unless near-term momentum can be restored against faster-rising leaders.

Notable Products
Pop Berry Gelato (3.5g) posted the steepest move in August 2026 with a -46.97% month-over-month decline and slid to rank 5, while Relapse (3.5g) also contracted by -16.38% and held rank 2. Gorilla Glue 2.0 (3.5g) fell -15.68% at rank 9, and OG Kush (3.5g) led at rank 1 with $39,548 in sales. With eight of the top ten SKUs in Flower and only two Pre-Rolls in ranks 6 and 10, the mix points to a Flower-led portfolio that is vulnerable to volatility in a few headline eighths, implying near-term emphasis on stabilizing flagship Flower while selectively nurturing Pre-Roll depth.
Top Selling Cannabis Brands






Data for this report comes from real-time sales reporting by participating cannabis retailers via their point-of-sale systems, which are linked up with Headset’s business intelligence software. Headset’s data is very reliable, as it comes digitally direct from our partner retailers. However, the potential does exist for misreporting in the instance of duplicates, incorrectly classified products, inaccurate entry of products into point-of-sale systems, or even simple human error at the point of purchase. Thus, there is a slight margin of error to consider. Brands listed on this page are ranked in the top twenty within the market and product category by total retail sales volume.

