.svg)

Aug-2026
Sales
Trend
6-Month
Product Count
SKUs
Avg Price
YoY Sales Change
YoY Price Change


Where to Buy
Stoner Village is stocked at 61 licensed dispensaries across Illinois, with the deepest coverage in Chicago, Joliet, Addison, Carbondale, and Darien. Search by ZIP code or city below to find the closest one, or filter by product type if you are after a specific format.
Market Insights Snapshot
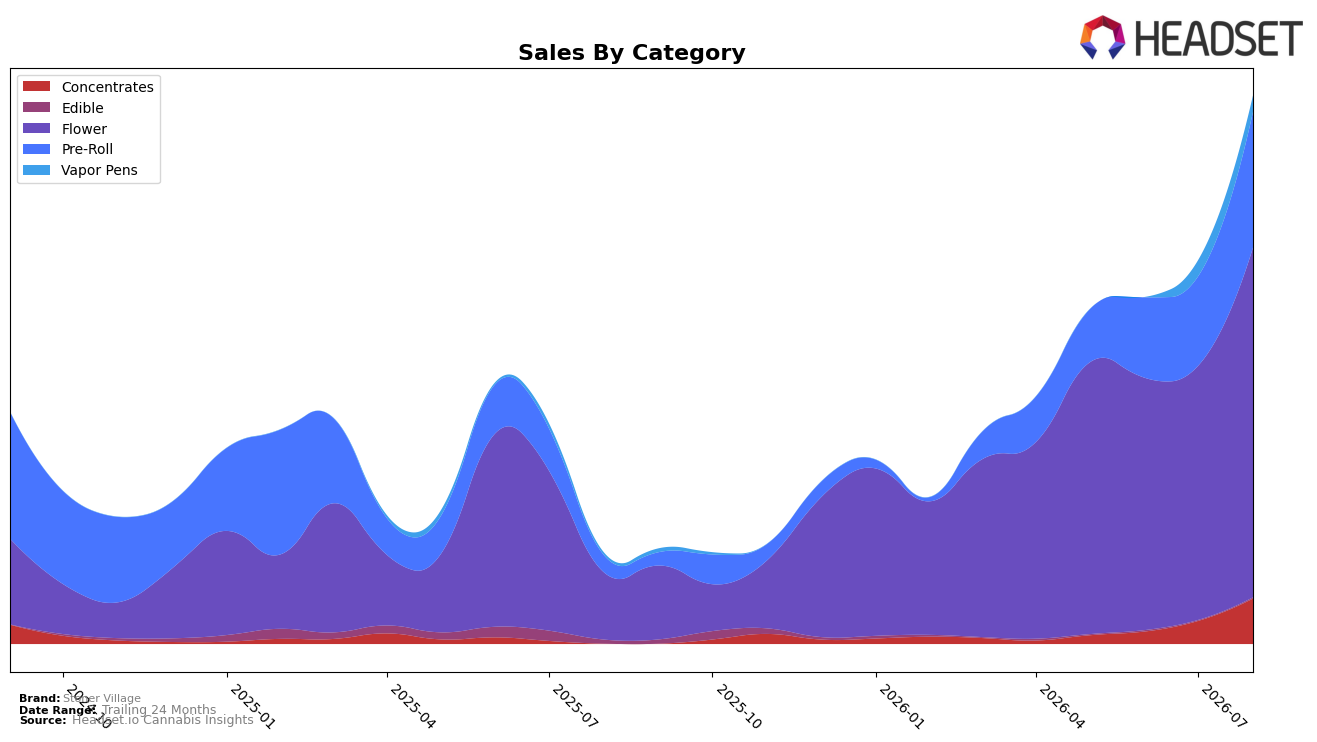
In August 2026, Stoner Village concentrated 63.87% of sales in Flower with year-over-year growth of 423.01% and month-over-month growth of 37.79%, while Pre-Roll held 24.75% share with an even faster 704.27% YoY and 52.08% MoM rise. Concentrates expanded to 8.27% share on a 98.99% MoM surge despite no YoY baseline, whereas Vapor Pens remained small at 2.96% share with 571.77% YoY but just 2.03% MoM growth; Edible contracted to 0.16% share with a -77.42% YoY despite a 33.63% MoM uptick. With average price down 21.51% YoY to $19.75 and Flower average price at $29.69, the mix shift toward rapidly scaling, lower-ticket Pre-Roll and volume-driven Flower suggests the brand is trading price for velocity to expand footprint in Illinois.
The mix pattern implies Stoner Village is positioning as a value-led inhalables player, leaning on Flower scale (ranked 61 in Flower in Illinois) and using aggressive Pre-Roll growth (52.08% MoM and 704.27% YoY) to capture trial, while seeding future premiumization via Concentrates’ 98.99% MoM lift. The muted 2.03% MoM in Vapor Pens alongside a -77.42% YoY in Edible indicates deliberate deprioritization of non-core form factors, and the 37.79% MoM in Flower paired with a 21.51% YoY price decline signals a volume-first stance that can improve shelf presence but may cap near-term average price recovery.
Competitive Landscape
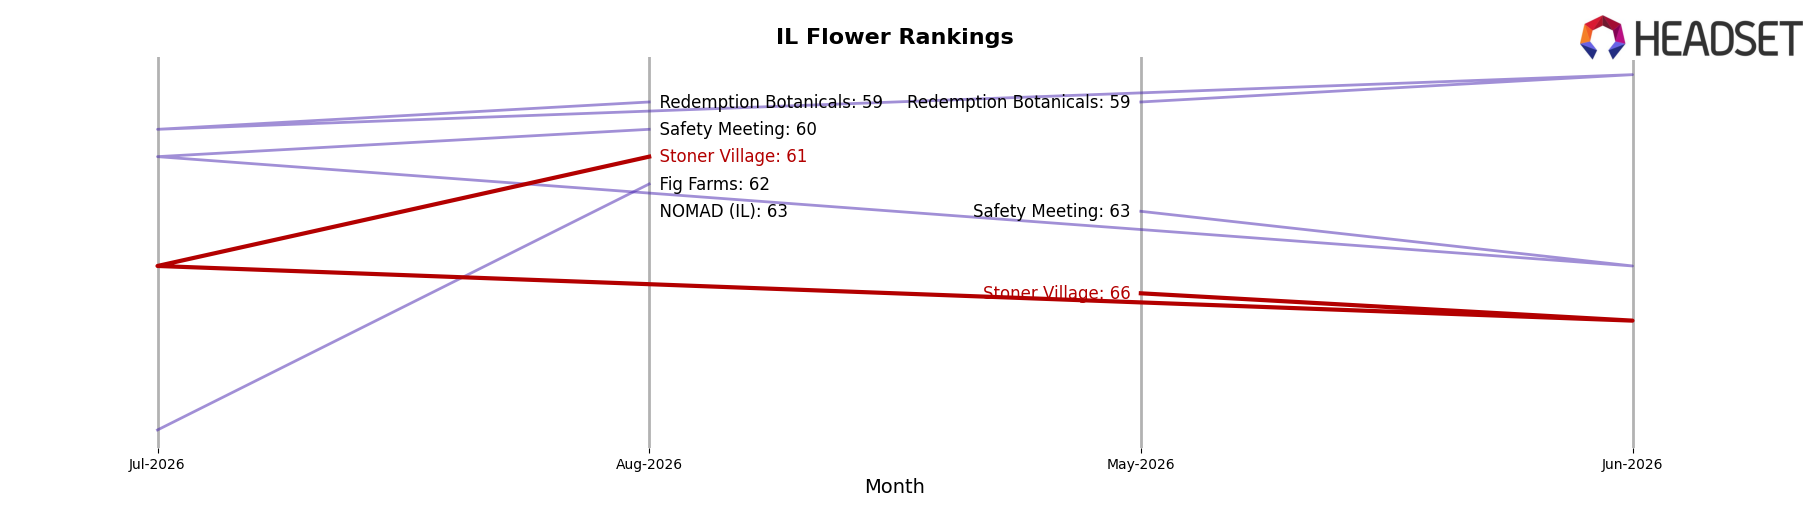
Stoner Village sits at rank #61 in IL Flower in August 2026, improving 16 positions from #77 year over year, and edging up 5 ranks from #66 three months prior, while also marking its peak rank at #61 in August 2026; in contrast, High Supply / Supply holds #1 with a -10.1% YoY sales change and The Botanist surged from #29 to #4 with a 482.1% YoY sales increase, indicating Stoner Village’s gain is paced but not matching the category’s fastest climbers. With RYTHM steady at #2 alongside a 36.5% YoY sales lift while Daze Off slipped from #4 to #5 on -6.1% YoY sales, the pattern suggests Stoner Village’s trajectory—modest rank ascent and timing of a new peak—implies incremental share capture rather than breakout displacement of top-tier incumbents.
Notable Products
Mint Chocolate Runtz Pre-Roll 5-Pack (2.5g) posted the largest month-over-month change at +107.4% and sits at rank 5, indicating a sharp acceleration within Pre-Rolls while rank 1 and rank 2 are also held by Pre-Roll SKUs. Black Cherry Gelato (3.5g) is rank 3 while Black Cherry Gelato Smalls (14g) is rank 9, and three of the top ten are Flower SKUs, signaling balanced pull between value and premium sizes even as Pre-Rolls concentrate five of the top ten. First Class Funk Pre-Roll (1g) rose +14.9% MoM at rank 6, whereas First Class Funk (3.5g) in Flower gained +6.7% at rank 7, with the Pre-Roll format outpacing its Flower counterpart and capturing faster repeat behavior. The product mix implies Stoner Village is tilting toward multi-pack and single-stick Pre-Rolls for velocity, using Black Cherry Gelato breadth to anchor Flower dollars at $20,307 while formats, not strains, set the growth curve.
Top Selling Cannabis Brands






Data for this report comes from real-time sales reporting by participating cannabis retailers via their point-of-sale systems, which are linked up with Headset’s business intelligence software. Headset’s data is very reliable, as it comes digitally direct from our partner retailers. However, the potential does exist for misreporting in the instance of duplicates, incorrectly classified products, inaccurate entry of products into point-of-sale systems, or even simple human error at the point of purchase. Thus, there is a slight margin of error to consider. Brands listed on this page are ranked in the top twenty within the market and product category by total retail sales volume.

