.svg)

Sep-2026
Sales
Trend
6-Month
Product Count
SKUs
Avg Price
YoY Sales Change
YoY Price Change


Where to Buy
ZAZA is stocked at 74 licensed dispensaries across Michigan, Oregon, and 2 other states, 61 of them in Michigan, with the deepest coverage in Detroit, New Buffalo, Monroe, Inkster, and Berkley. Search by ZIP code or city below to find the closest one, or filter by product type if you are after a specific format.
Market Insights Snapshot
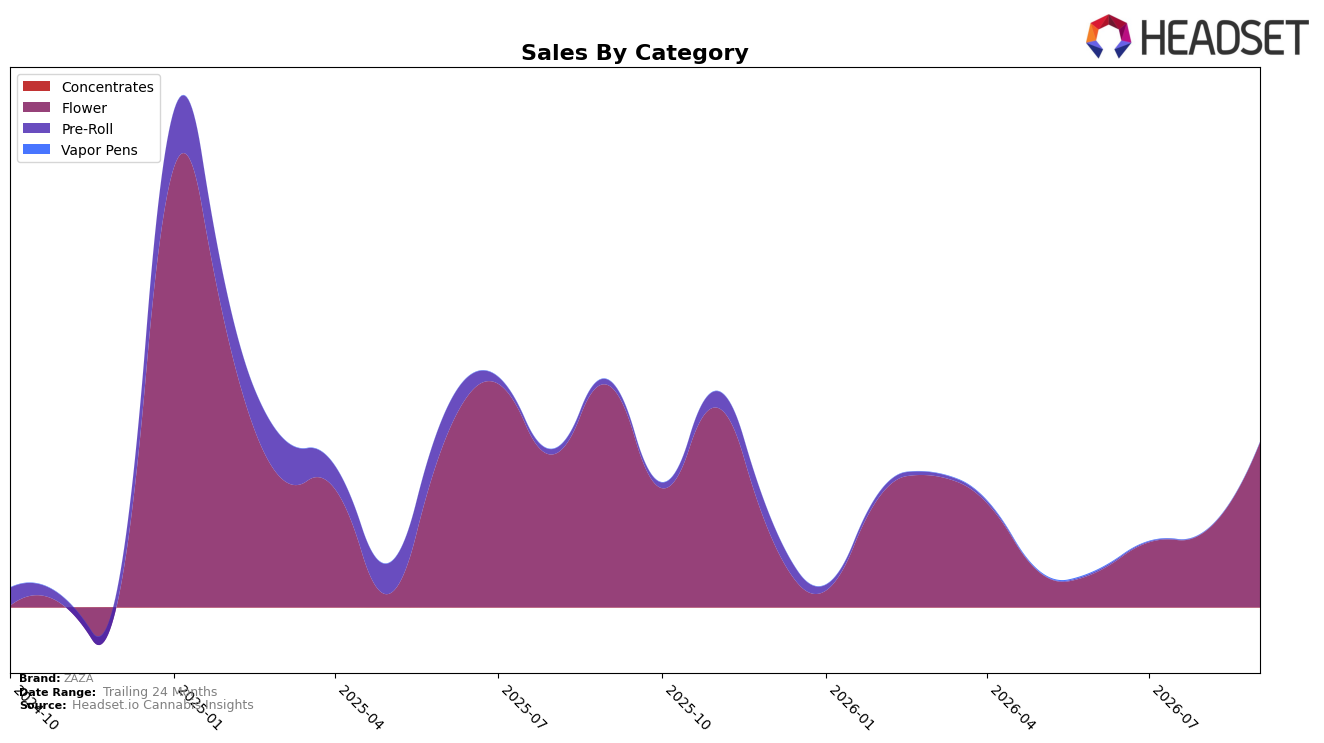
In September 2026, ZAZA operated as a single-category brand with Flower accounting for 100.0% of sales, while Flower sales contracted year over year by 25.8% and expanded month over month by 119.0%. Despite a 27.4% brand-level sales decline year over year, the average price rose 9.1%, indicating mix and pricing moved in opposite directions; within Flower specifically, pricing at $19.34 coincided with a sharp MoM volume rebound implied by the 119.0% lift. In British Columbia, ZAZA ranked at position 50 in Flower, placing it well down the leaderboard and suggesting that the MoM spike did not translate into a commensurate rank improvement. The pattern implies ZAZA’s September momentum was driven by a short-cycle recovery in its sole category rather than diversified demand, leaving overall performance exposed to Flower volatility.
Concentration in a single category alongside a 9.1% YoY price increase and a 27.4% YoY brand sales decline suggests ZAZA traded some volume for price while relying on a September MoM surge of 119.0% to stabilize near-term throughput. Holding the 50 rank in Flower in British Columbia alongside a 25.8% YoY Flower contraction indicates limited share capture despite price elevation and a short-term MoM bounce. The implication is that ZAZA’s positioning skews toward tactical pricing and episodic demand spikes rather than sustained share progression, and the current single-category footprint concentrates risk and caps rank mobility without mix expansion.
Competitive Landscape
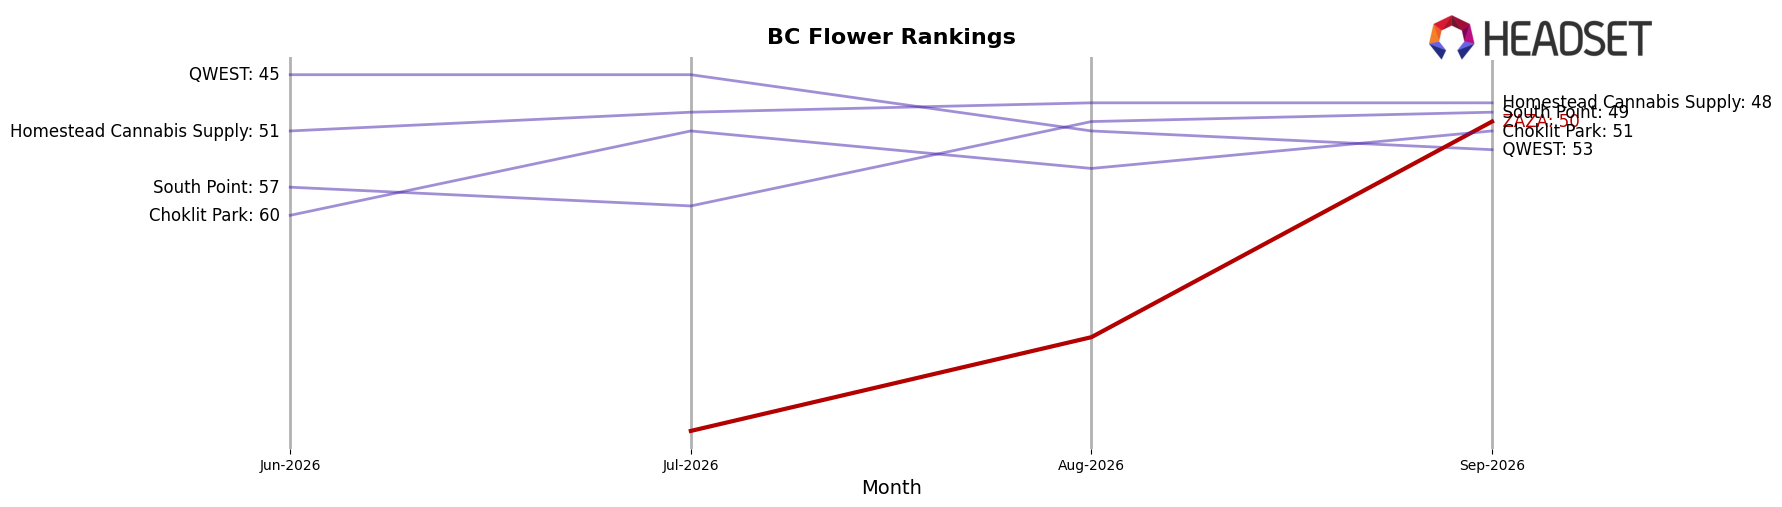
ZAZA ranks #50 in BC Flower in September 2026, with no year-over-year rank available and a peak rank of #50 also in September 2026, while Good Supply moved from #8 to #2 (+6 positions) and Pure Sunfarms advanced from #12 to #5 (+7 positions); against this backdrop, Big Bag O' Buds held #1 year over year (0-position change) and grew sales 13.73%, and Spinach climbed from #4 to #3 (+1) with 20.88% sales growth, indicating that ZAZA’s static entry at #50 amid upward mobility from multiple leaders implies a need to change velocity drivers to avoid getting locked into the bottom decile as share concentrates higher up the rankings.
Notable Products
White Cherry Gelato (3.5g) posted the largest month-over-month surge at +145.6% to rank 2, while Midnight OG Smalls (3.5g) climbed +138.0% to rank 1 with $102,200 in September 2026. Two SKUs shared rank 3 — Scented Marker (3.5g) and Super Lemon Cherry (3.5g) — indicating a tie at the threshold of the podium and concentrating four of the top ten in the Flower category. The pattern implies a sharp pivot toward a winner-take-most Flower lineup where outsized gains in two flagship eighths signal a strategy to consolidate velocity behind a narrow set of leaders.
Top Selling Cannabis Brands






Data for this report comes from real-time sales reporting by participating cannabis retailers via their point-of-sale systems, which are linked up with Headset’s business intelligence software. Headset’s data is very reliable, as it comes digitally direct from our partner retailers. However, the potential does exist for misreporting in the instance of duplicates, incorrectly classified products, inaccurate entry of products into point-of-sale systems, or even simple human error at the point of purchase. Thus, there is a slight margin of error to consider. Brands listed on this page are ranked in the top twenty within the market and product category by total retail sales volume.

