.svg)
Aug-2026
Sales
Trend
6-Month
Product Count
SKUs
Avg Price
YoY Sales Change
YoY Price Change



Where to Buy
Five Islands is stocked at 88 licensed dispensaries across Massachusetts, Connecticut, and Maine, 58 of them in Massachusetts, with the deepest coverage in Worcester, Boston, Fall River, Newton, and Quincy. Search by ZIP code or city below to find the closest one, or filter by product type if you are after a specific format.
Market Insights Snapshot
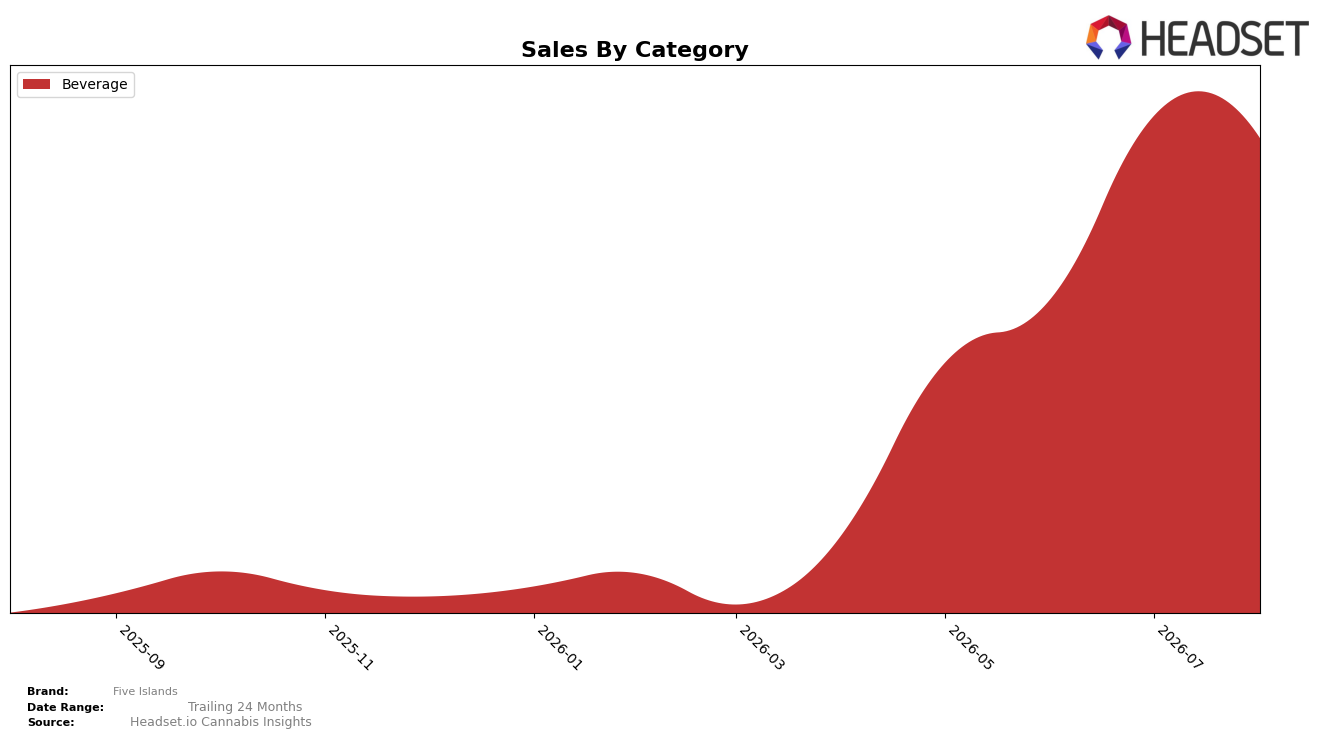
In August 2026, Five Islands concentrated entirely in Beverage, with a 100.0% category share and a year-over-year sales change of 1347.93% alongside a month-over-month decline of 4.16%. Average price rose 48.14% YoY to $6.23 while category rank in Beverage within Connecticut stood at 6, indicating mid-tier placement despite the sharp YoY expansion. With MA as the top state and Beverage holding full mix share, the pattern implies Five Islands is executing a narrow, price-led scale-up that expanded rapidly year over year but is now encountering a short-term MoM pullback as pricing resets demand.
Positioning-wise, a 100.0% Beverage mix paired with a Connecticut Beverage rank of 6 suggests clear category specialization but limited diversification levers if monthly volatility persists. The 48.14% YoY price increase concurrent with a 4.16% MoM sales dip indicates demand sensitivity at the higher price point, while the 1347.93% YoY surge signals a recently expanded footprint that may still be stabilizing; the implication is that Five Islands can defend share near rank 6 by balancing price with velocity rather than widening the category set in the near term.
Competitive Landscape
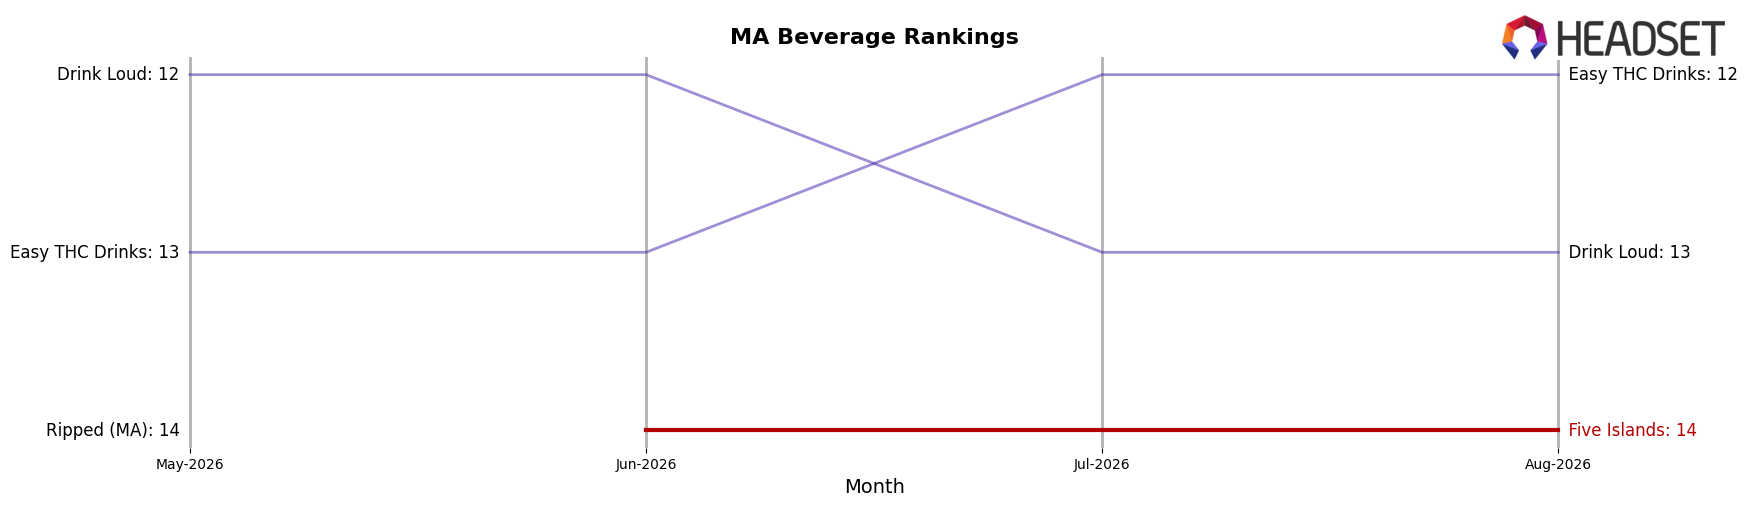
Five Islands ranks #14 in MA Beverage in August 2026, up 1 position from #15 in May 2026, and matching its peak rank of #14 in August 2026; the move contrasts with Pine + Star advancing from #5 to #4 while Buzzy holds at #3 with a -4.9% year-over-year sales change. Compared with Levia steady at #1 with +6.0% year-over-year sales and Hi5 Seltzer steady at #2 with +23.6% year-over-year sales, Five Islands’ single-rank climb from #15 to #14 indicates minor share capture against stable leaders; the trajectory implies incremental gains are possible but require outpacing competitors that are either advancing in rank (e.g., #5 to #4) or growing sales at double-digit rates.
Notable Products
CBD/THC 2:3 Peach Iced Tea (2mg CBD, 3mg THC, 12oz, 355ml) posted the largest move in August 2026 with +174.9% MoM to rank 2, while Classic Tea (5mg THC, 12oz, 355ml) fell -78.6% to rank 9. CBD/THC 2:3 Half and Half Iced Tea (2mg CBD, 3mg THC, 12oz, 355ml) also climbed +57.9% to rank 1 as Raspberry Tea (5mg THC, 12oz, 355ml) slid -30.3% to rank 3. With eight of the top ten being single-can beverages and only two 4-packs in ranks 7 and 10, the sharp gains in low-dose 2:3 SKUs alongside double-digit declines of several 5mg THC classics imply a consumer pivot toward lighter, CBD-inclusive formats that can sustain premium single-unit pricing rather than multi-pack volume plays.
Top Selling Cannabis Brands






Data for this report comes from real-time sales reporting by participating cannabis retailers via their point-of-sale systems, which are linked up with Headset’s business intelligence software. Headset’s data is very reliable, as it comes digitally direct from our partner retailers. However, the potential does exist for misreporting in the instance of duplicates, incorrectly classified products, inaccurate entry of products into point-of-sale systems, or even simple human error at the point of purchase. Thus, there is a slight margin of error to consider. Brands listed on this page are ranked in the top twenty within the market and product category by total retail sales volume.

