.svg)

Aug-2026
Sales
Trend
6-Month
Product Count
SKUs
Avg Price
YoY Sales Change
YoY Price Change


Market Insights Snapshot
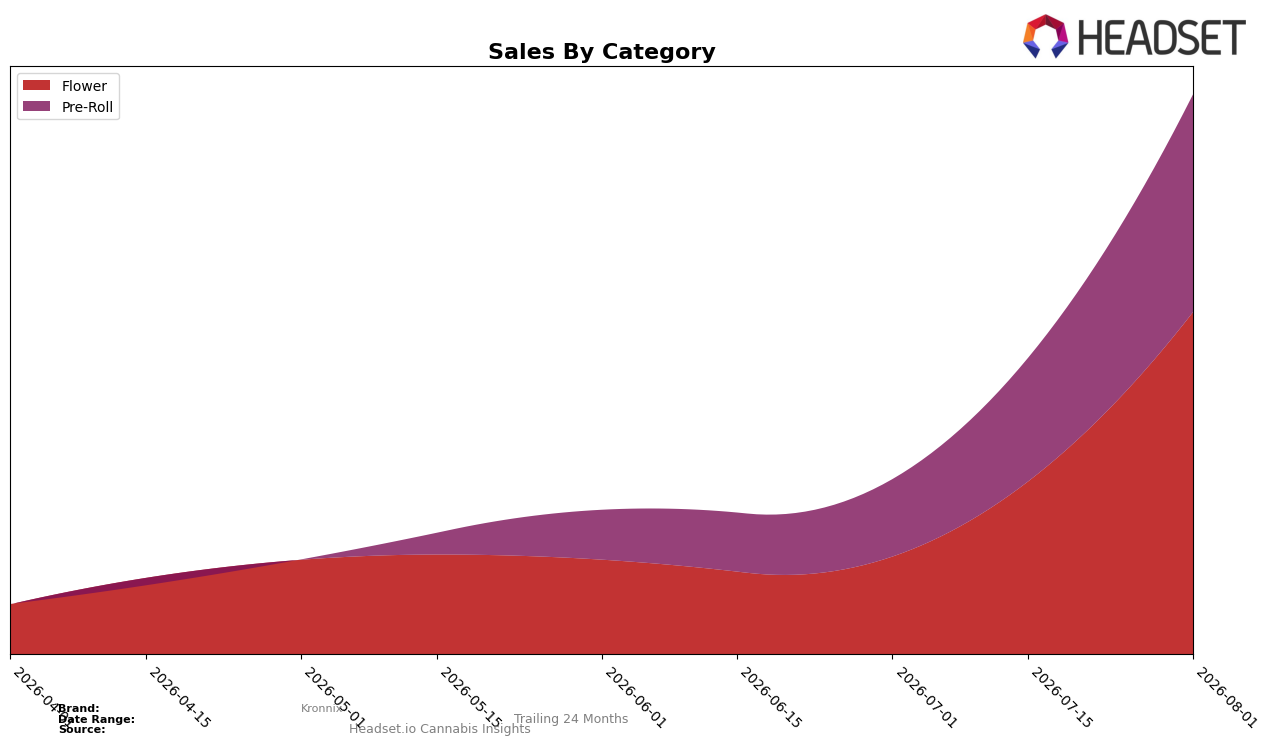
In August 2026, Kronnix concentrated sales in Flower at 61.13% share while Pre-Roll held 38.87%, with Flower surging 251.03% month over month and Pre-Roll up 181.79% month over month; the brand’s average price sat at $20.74 alongside a higher Flower average price of $25.57. Within the Flower space, Kronnix ranked 39 in Alberta, a position that, paired with a 251.03% MoM acceleration and a 38.87% Pre-Roll share, implies the brand is shifting mix toward higher-priced Flower while maintaining a sizable Pre-Roll base to capture volume.
The step-up in Flower share to 61.13% alongside a 181.79% MoM lift in Pre-Roll suggests Kronnix is using Flower as the lead category while Pre-Roll provides secondary throughput, positioning the brand to trade consumers up from $15.99 Pre-Roll to $25.57 Flower without abandoning value seekers. Holding rank 39 in Alberta Flower while expanding mix by 22.26 percentage points versus an even 50/50 split implies headroom: the 251.03% MoM Flower growth relative to the 181.79% MoM Pre-Roll growth signals a price-led, potency-associated proposition that can convert trial into repeat in Flower while keeping entry via Pre-Roll.
Competitive Landscape
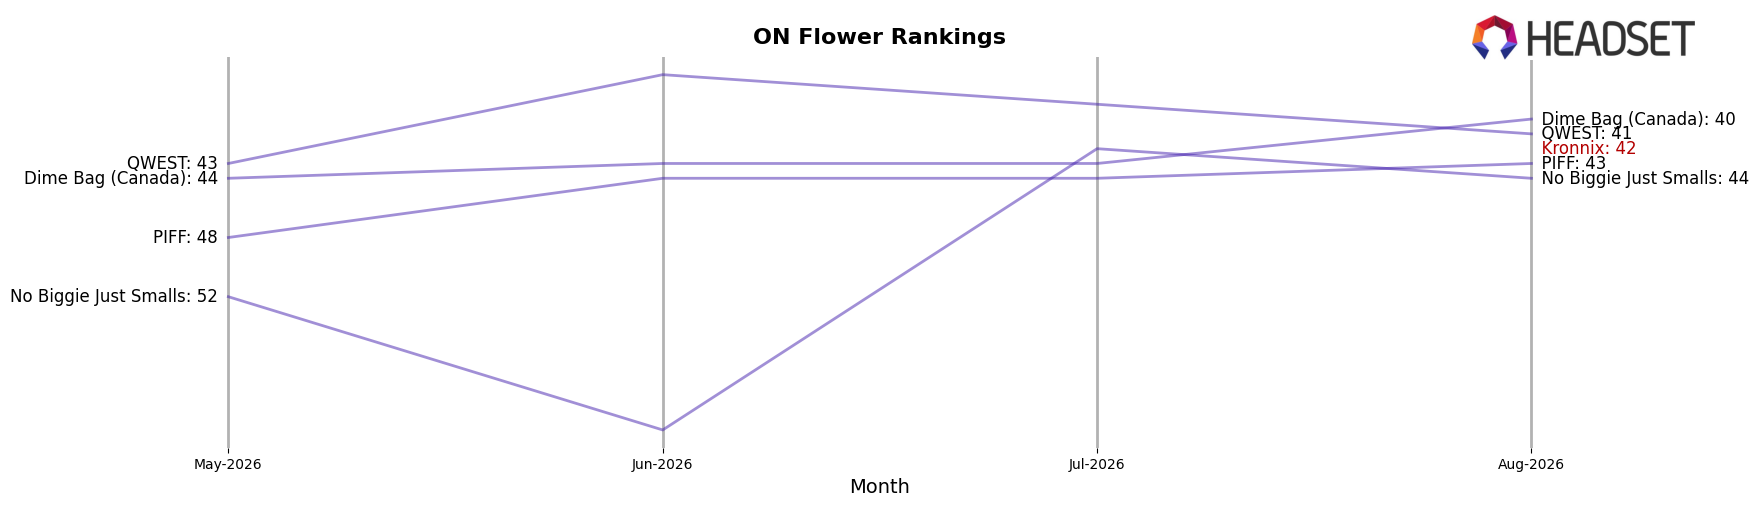
Kronnix sits at rank #42 in ON Flower as of August 2026, with year-over-year rank change unavailable and a peak position matching the current #42; this flat peak-to-current alignment implies no upward reranking despite market churn where Shred moved from #2 to #1 and expanded sales by 18.96%, while Spinach climbed from #4 to #2 alongside a 27.45% sales increase; meanwhile, The Original Fraser Valley Weed Co. fell from #6 to #5 with a -17.49% sales change, contrasting with Big Bag O' Buds slipping from #1 to #4 despite a 1.46% lift, indicating that Kronnix’s static rank at #42 in August 2026, even as leaders reshuffle at the top three positions, implies limited share capture and a need to target niches where negative competitor momentum opens pockets of accessible demand.
Notable Products
Dragon Cake Milled (7g) posted the largest month-over-month move in August 2026 with +258.8% and jumped to rank 1, while Lemon Gem Milled (14g) also surged +258.0% to rank 6. Across formats, Sapphire Kush Milled (7g) climbed +236.8% to rank 3 and Dragon Cake Pre-Roll 2-Pack (2g) rose +244.2% to rank 2, indicating parallel momentum in both milled flower and pre-rolls. With three Flower SKUs in the top six and three Pre-Roll SKUs also in the top six, the mix concentrates in value-oriented, convenience formats; the pattern implies Kronnix is leaning into scaled, price-per-gram propositions that convert across adjacent form factors.
Top Selling Cannabis Brands






Data for this report comes from real-time sales reporting by participating cannabis retailers via their point-of-sale systems, which are linked up with Headset’s business intelligence software. Headset’s data is very reliable, as it comes digitally direct from our partner retailers. However, the potential does exist for misreporting in the instance of duplicates, incorrectly classified products, inaccurate entry of products into point-of-sale systems, or even simple human error at the point of purchase. Thus, there is a slight margin of error to consider. Brands listed on this page are ranked in the top twenty within the market and product category by total retail sales volume.

