.svg)


Where to Buy
Otherside is stocked at 52 licensed dispensaries across Illinois, with the deepest coverage in Chicago, Addison, East Peoria, Aurora, and Batavia. Search by ZIP code or city below to find the closest one, or filter by product type if you are after a specific format.
Market Insights Snapshot
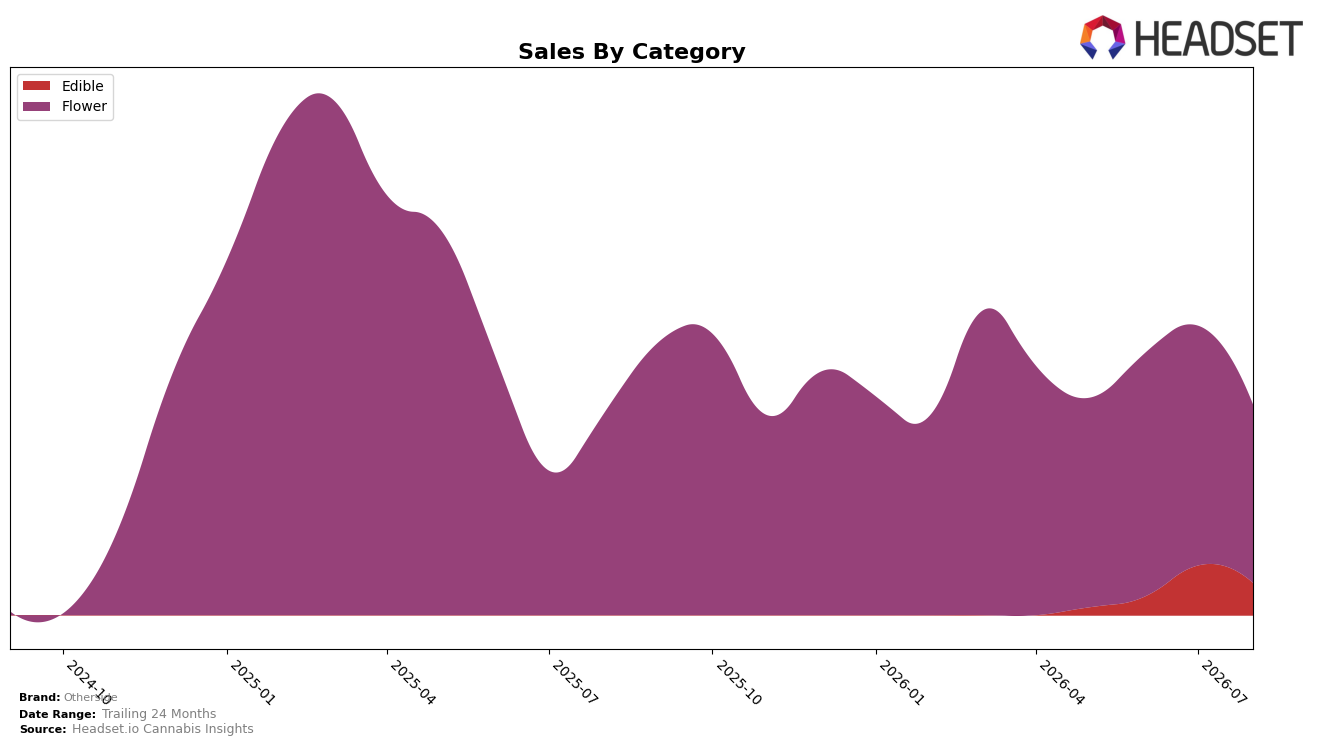
In August 2026, Otherside concentrated 84.63% of sales in Flower while Edible accounted for 15.37%, a mix that tightened as Flower fell 25.70% month over month and 11.67% year over year, and Edible declined 35.01% month over month with no year-over-year baseline reported. The brand’s average price dropped 35.59% year over year to $30.68, while the Flower segment carried a higher average price of $45.20, signaling downshifts in pricing alongside share consolidation; paired with a 4.37% year-over-year brand sales increase against a Flower contraction, the pattern implies unit-led gains offsetting category softness.
With Flower ranked 47 in Illinois and holding 84.63% share, the double-digit month-over-month pullback in Flower at 25.70% compared with a steeper 35.01% in Edible indicates reliance on a weakening primary category and limited cushioning from secondary formats. The divergence between a 4.37% year-over-year brand sales rise and an 11.67% Flower decline, alongside a 35.59% price reduction, implies a positioning pivot toward value-driven volume in Flower rather than diversification, signaling exposure to rank pressure in Illinois if price elasticity or category headwinds deepen.
Competitive Landscape
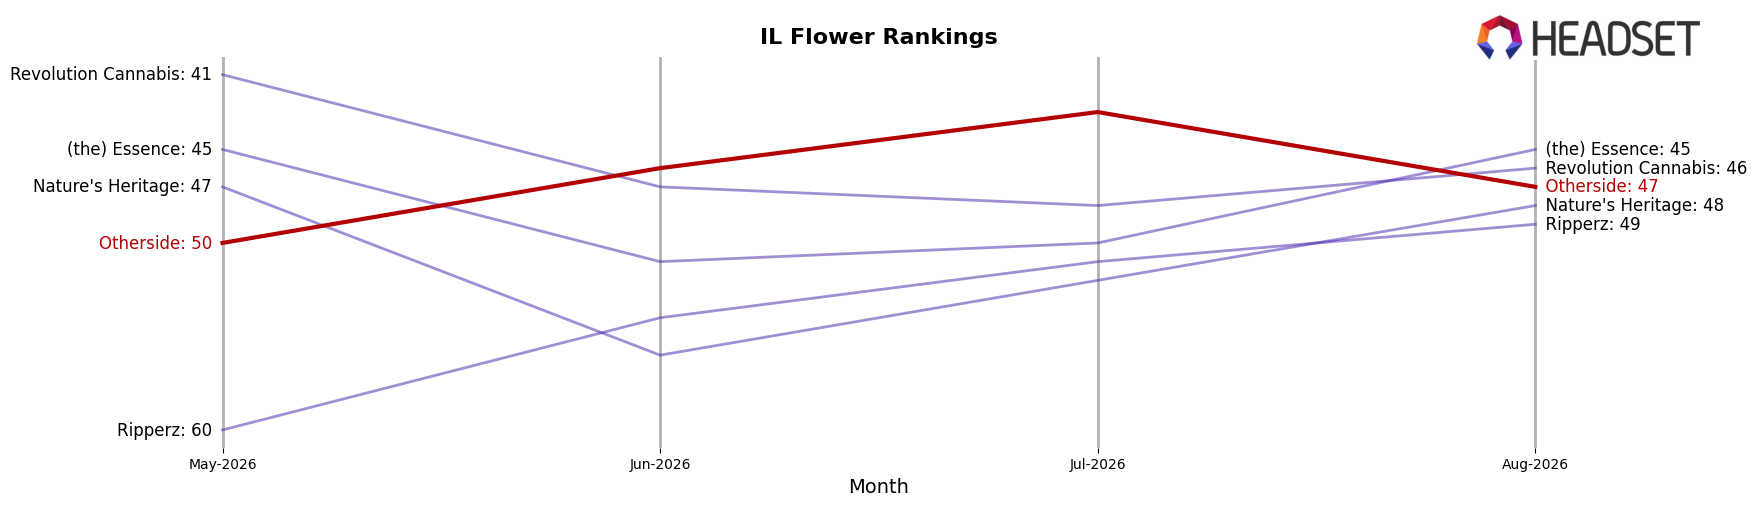
Otherside sits at #47 in August 2026 in IL Flower, slipping 3 positions year over year from #44 while improving 3 spots versus three months ago from #50; despite a historical peak at #30 in February 2025, the brand’s current placement lags the category’s upper tier where High Supply / Supply held steady at #1 year over year and The Botanist surged from #29 to #4. With RYTHM maintaining #2 while growing sales 36.45% and Good Green holding #3 despite a 5.10% sales decline, Otherside’s downward YoY rank shift alongside modest recent quarter-on-quarter recovery implies a brand stabilizing below its prior ceiling unless it can convert near-term momentum into sustained share gains.
Notable Products
Cosmic - Sour Lemon Chew (100mg) led the month with the steepest decline at -73.6% MoM, sliding to rank 9, while Wild Blueberry Hash Oil Gummies (100mg) fell -55.7% to rank 7. In contrast, Rainbow Zangria (3.5g) climbed 26.6% MoM to rank 3, and Cosmic - Sour Lemon Full Spectrum Hash Oil Chews 10-Pack (100mg) dropped -25.0% to rank 4. Four of the top ten are Edible SKUs, yet three of those Edibles posted declines worse than -25%, indicating mix pressure away from confections toward Flower. This pattern implies Otherside is tilting toward Flower-led velocity as Edible volatility erodes depth, and August 2026 assortment choices should prioritize scalable Flower formats over duplicative Edible variants.
Top Selling Cannabis Brands






Data for this report comes from real-time sales reporting by participating cannabis retailers via their point-of-sale systems, which are linked up with Headset’s business intelligence software. Headset’s data is very reliable, as it comes digitally direct from our partner retailers. However, the potential does exist for misreporting in the instance of duplicates, incorrectly classified products, inaccurate entry of products into point-of-sale systems, or even simple human error at the point of purchase. Thus, there is a slight margin of error to consider. Brands listed on this page are ranked in the top twenty within the market and product category by total retail sales volume.

