.svg)
Aug-2026
Sales
Trend
6-Month
Product Count
SKUs
Avg Price
YoY Sales Change
YoY Price Change


Where to Buy
Sour Family Farms is stocked at 62 licensed dispensaries across Illinois, with the deepest coverage in Chicago, Joliet, Carbondale, Darien, and East Dubuque. Search by ZIP code or city below to find the closest one, or filter by product type if you are after a specific format.
Market Insights Snapshot
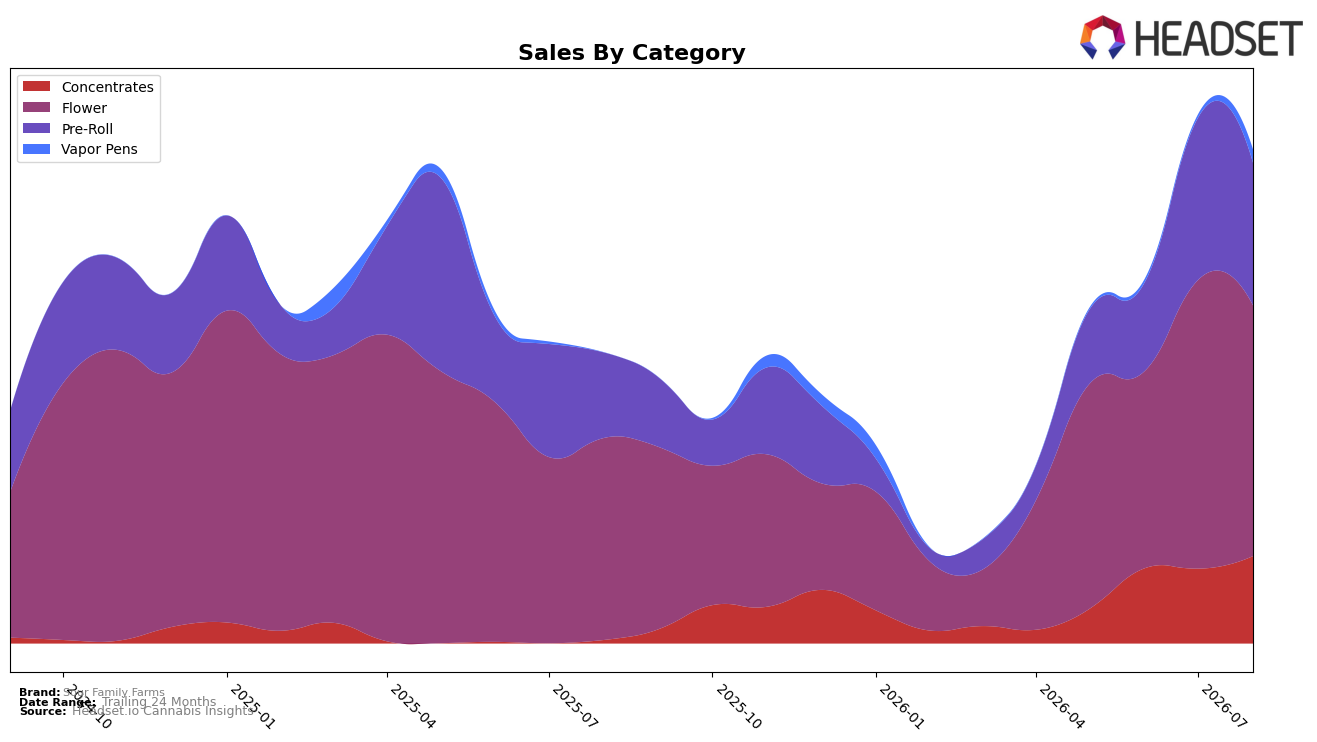
In August 2026, Sour Family Farms leaned heavily into Flower at 50.78% share while holding the 71 rank in Flower in Illinois, yet the category’s -13.17% MoM alongside a 24.08% YoY rise signals a cooling after expansion; Pre-Roll at 28.86% share posted -12.15% MoM against 66.97% YoY, indicating repeat demand growth but near-term pullback. The outlier was Concentrates at 17.70% share with 16.85% MoM and 2,527.72% YoY, and Vapor Pens at 2.67% share surged 309.21% MoM despite no YoY baseline, together implying the brand is reallocating momentum from declining MoM inhalable staples toward higher-velocity dabbables and entry Vapor, while overall brand sales grew 69.84% YoY and average price fell 7.15% YoY.
These shifts imply a repositioning from a Flower-led identity toward a potency- and format-diverse portfolio: Concentrates’ 16.85% MoM gain paired with a 2,527.72% YoY jump, alongside Vapor Pens’ 309.21% MoM, can offset Flower’s -13.17% MoM and Pre-Roll’s -12.15% MoM, potentially improving category mix resilience despite a 71 rank in Flower in Illinois. With average prices down 7.15% YoY while high-THC categories expand share (Concentrates 17.70%, Vapor Pens 2.67%), the thesis is margin management via trade-up on potency and basket-size defense: lift units in faster-growth formats to sustain the 69.84% YoY brand sales increase even as core inhalables cycle down month-over-month.
Competitive Landscape
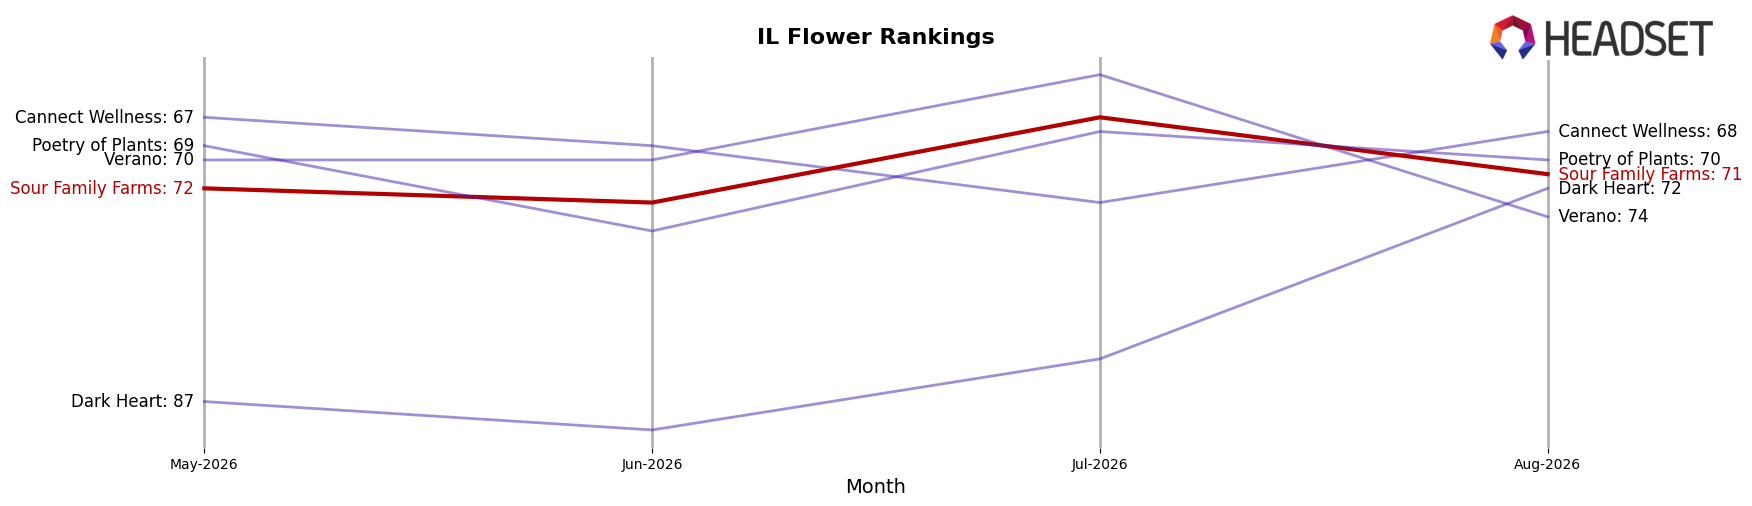
Sour Family Farms sits at rank 71 in Illinois Flower for August 2026, down 5 positions year over year from rank 66, and up 1 position versus three months ago from rank 72; its historical ceiling remains rank 54 from April 2025, placing a 17-rank gap to prior peak. Competitive context tightened at the top: High Supply / Supply held rank 1 year over year while posting a 10.13% sales decline, and RYTHM maintained rank 2 with 36.45% sales growth, whereas The Botanist climbed from rank 29 to rank 4 alongside a 482.08% sales increase; by contrast, Daze Off slipped from rank 4 to rank 5 with a 6.13% sales decline. The combination of a 5-place YoY slide and only a 1-place sequential uptick implies Sour Family Farms is stabilizing below its April 2025 peak and will need share wins against faster risers to reverse a longer-term downtrend.
Notable Products
LMNO-Z Pre-Roll (1g) posted the steepest decline at -67.8% and slipped to rank 7, while LMNO-Z (3.5g) fell -39.1% to rank 6, signaling acute strain-specific drag within LMNO-Z. In contrast, Sour Diesel Pre-Roll 5-Pack (2.5g) surged +107.2% to rank 3 and Hawaiian Haze Pre-Roll (1g) climbed +46.8% to hold rank 1, and four of the top ten are Pre-Roll SKUs, indicating a pivot toward multi-stick and single-stick inhalables over flower. With Grapefruit Chem (3.5g) up +8.3% at rank 2 and SNL (3.5g) up +15.1% at rank 10, flower remains relevant but is ceding momentum to Pre-Roll formats. The mix implies Sour Family Farms is consolidating around faster-turn Pre-Roll offerings while deprioritizing LMNO-Z variants despite LMNO-Z Bubble Hash (1g) entering the top ten with $6,519 in August 2026.
Top Selling Cannabis Brands






Data for this report comes from real-time sales reporting by participating cannabis retailers via their point-of-sale systems, which are linked up with Headset’s business intelligence software. Headset’s data is very reliable, as it comes digitally direct from our partner retailers. However, the potential does exist for misreporting in the instance of duplicates, incorrectly classified products, inaccurate entry of products into point-of-sale systems, or even simple human error at the point of purchase. Thus, there is a slight margin of error to consider. Brands listed on this page are ranked in the top twenty within the market and product category by total retail sales volume.

