.svg)
Aug-2026
Sales
Trend
6-Month
Product Count
SKUs
Avg Price
YoY Sales Change
YoY Price Change


Where to Buy
TS Labs is stocked at 65 licensed dispensaries across Colorado, with the deepest coverage in Colorado Springs, Denver, Boulder, Cortez, and Pueblo. Search by ZIP code or city below to find the closest one, or filter by product type if you are after a specific format.
Market Insights Snapshot
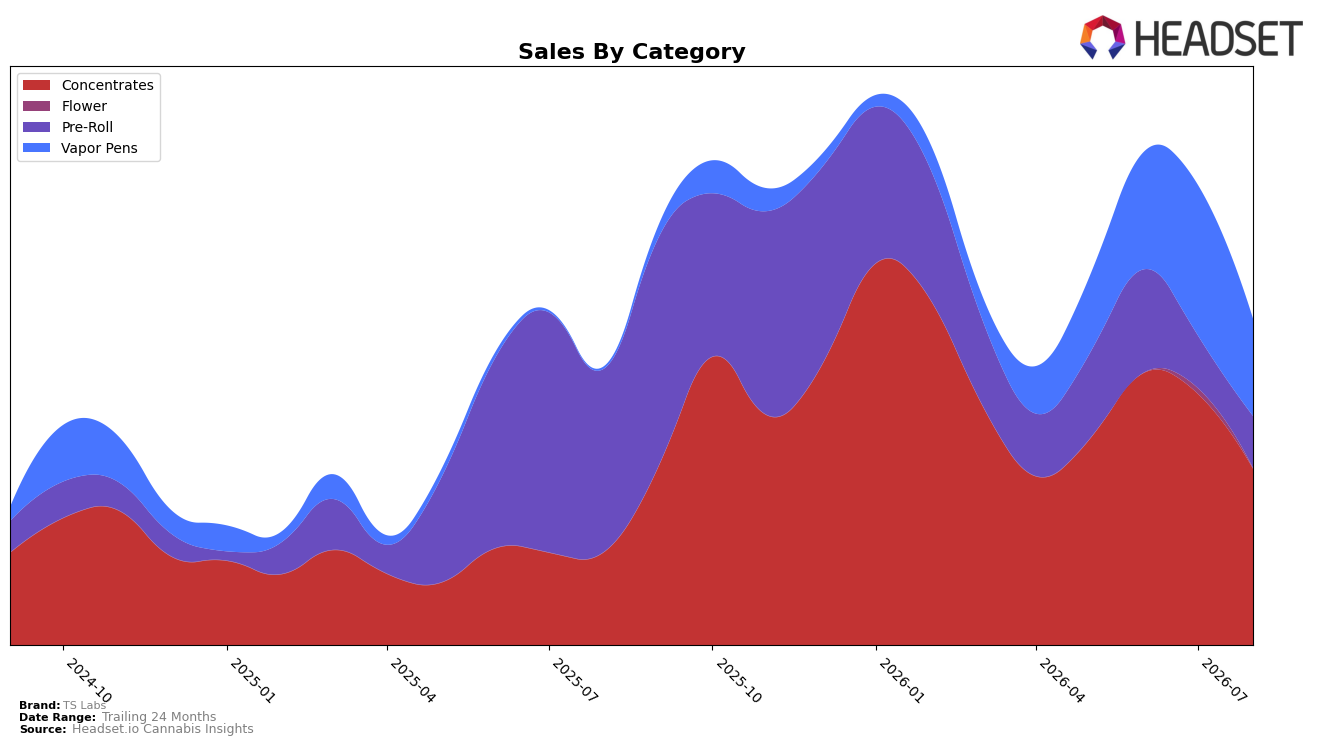
In August 2026, TS Labs concentrated its mix around Concentrates at 54.17% share with 89.93% year-over-year growth but a 29.85% month-over-month decline, while Vapor Pens expanded to 29.82% share with a 4,422.49% year-over-year surge yet a 35.46% month-over-month pullback. Pre-Roll contracted to 15.90% share with a 71.73% year-over-year drop and a 1.27% month-over-month dip, and Flower shrank to 0.11% share with a 93.19% month-over-month fall. The combination of rapid year-over-year gains in Concentrates and Vapor Pens with simultaneous month-over-month declines across all categories implies that TS Labs is scaling into higher-value inhalable formats while absorbing a short-term reset in August 2026.
The tilt toward Concentrates (54.17% share, average price $27.997) alongside high-priced Vapor Pens (average price $44.85) against a brand-wide average price up 64.42% year over year indicates revenue strategy centered on premium inhalables, while Pre-Roll’s 71.73% year-over-year contraction and Flower’s 0.11% share suggest deliberate deprioritization of lower-priced combustion formats. Given a rank of 36 in Concentrates in Colorado and concurrent month-over-month declines of 29.85% in Concentrates and 35.46% in Vapor Pens, the pattern implies TS Labs is trading depth for margin concentration, positioning as a specialized inhalables player that will need steadier repeat velocity to convert its year-over-year gains into sustained rank improvement.
Competitive Landscape
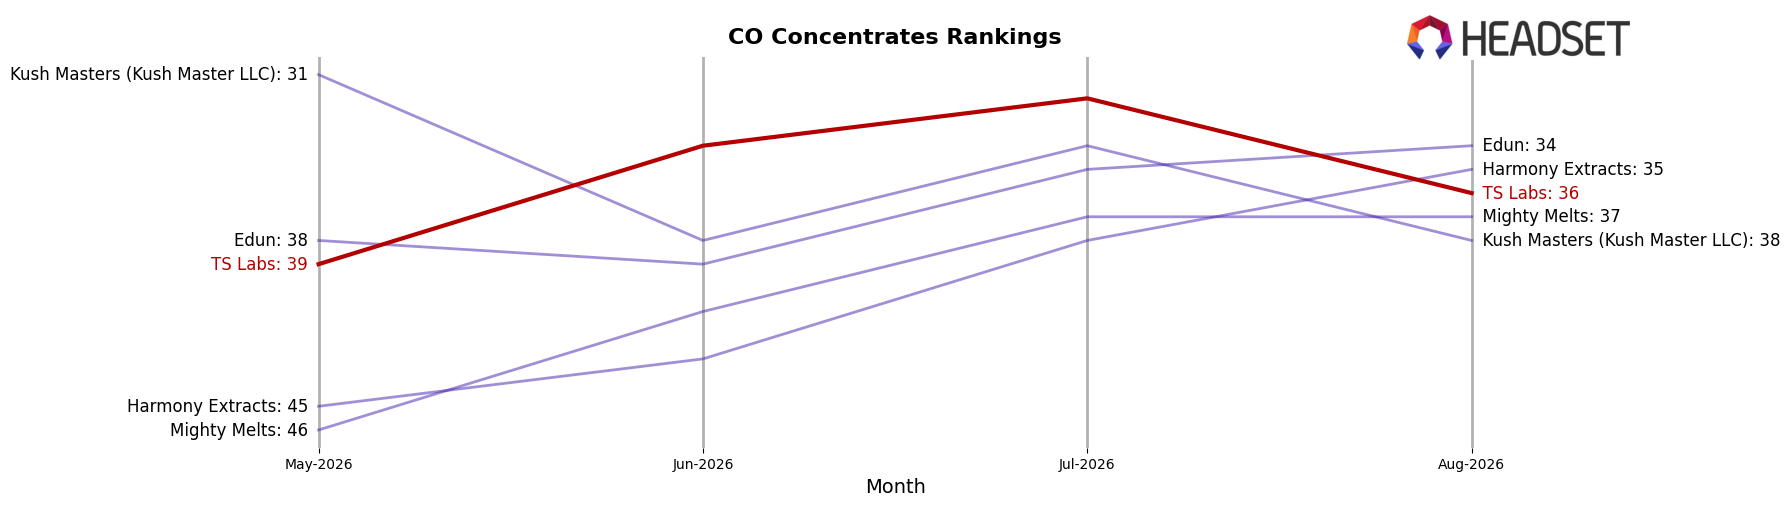
TS Labs sits at rank 36 in Colorado Concentrates in August 2026, improving 17 positions from rank 53 year over year, while slipping 3 spots from rank 39 in May 2026 and remaining below its peak rank of 31 reached in January 2026; meanwhile, Amber climbed from #2 to #1 and 710 Labs fell from #1 to #3 with a 10.1% YoY sales decline, indicating that TS Labs’ upward YoY rank change is occurring amid leadership churn where the top slot tightened and former leaders ceded ground. The pattern implies TS Labs has momentum off its January 2026 high but must convert a 17-rank YoY gain into sustained top-30 penetration as category leadership consolidates at the very top.
Notable Products
Rainbow Taffy Live Rosin Infused Pre-Roll (1g) posted the largest month-over-month move in August 2026 at +91.9% while holding rank 2, and Indica Rosin Disposable (1g) rose +62.2% to rank 1, together pointing to accelerated uptake in inhalable formats. Cloudwalker Cold Cure Live Rosin (1g) fell -24.4% at rank 6 as Lemon Ice Pie Live Rosin (1g) grew +11.0% at rank 7, indicating intra-Concentrates share rotation away from a previously higher-volume SKU. Four of the top ten are Pre-Roll SKUs concentrated between ranks 2 and 10 with one reaching $2,625 in August 2026, and Red Bullz Live Rosin Infused Pre-Roll (1g) added +25.0% at rank 3, implying demand is tilting toward infused Pre-Rolls even as Vapor Pens lead the chart.
Top Selling Cannabis Brands






Data for this report comes from real-time sales reporting by participating cannabis retailers via their point-of-sale systems, which are linked up with Headset’s business intelligence software. Headset’s data is very reliable, as it comes digitally direct from our partner retailers. However, the potential does exist for misreporting in the instance of duplicates, incorrectly classified products, inaccurate entry of products into point-of-sale systems, or even simple human error at the point of purchase. Thus, there is a slight margin of error to consider. Brands listed on this page are ranked in the top twenty within the market and product category by total retail sales volume.

