.svg)

Aug-2026
Sales
Trend
6-Month
Product Count
SKUs
Avg Price
YoY Sales Change
YoY Price Change


Where to Buy
CMS Gardens is stocked at 57 licensed dispensaries across Massachusetts and Rhode Island, 51 of them in Massachusetts, with the deepest coverage in Easthampton, Fall River, Gloucester, Great Barrington, and Haverhill. Search by ZIP code or city below to find the closest one, or filter by product type if you are after a specific format.
Market Insights Snapshot
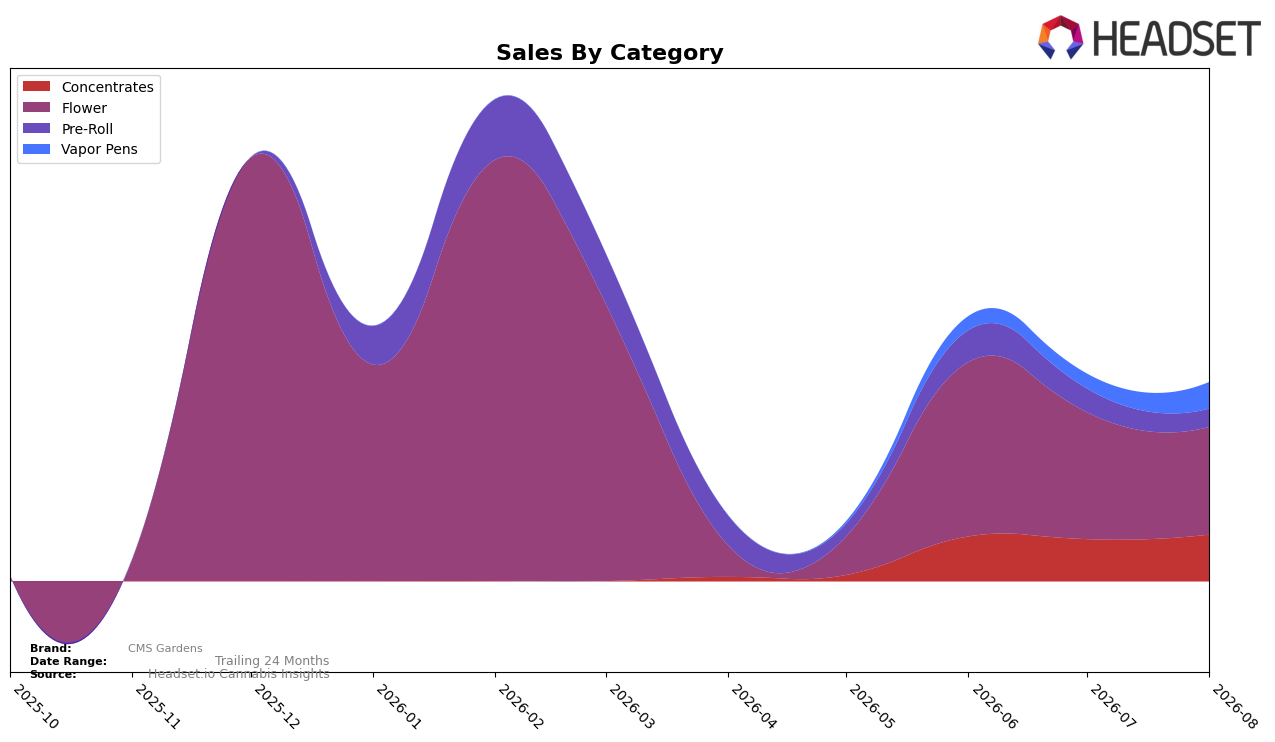
In August 2026, Flower held 54.19% share with a month-over-month decline of 15.26%, while Concentrates rose 10.69% MoM to 23.47% share; Vapor Pens surged 80.55% MoM to 13.28% share as Pre-Roll fell 23.33% MoM to 9.06% share. Within Massachusetts Flower, CMS Gardens sat at rank 95, and the widening gap between Pre-Roll’s 9.06% share and Vapor Pens’ 13.28% indicates a pivot away from value-led formats toward higher ticket inhalables, implying a short-term reallocation of demand into formats with higher average prices despite Flower volume pressure.
The shift toward Vapor Pens and Concentrates—up 80.55% and 10.69% MoM respectively—against double-digit pullbacks in Flower and Pre-Roll at -15.26% and -23.33% reshapes CMS Gardens’ positioning toward potency- and convenience-oriented occasions rather than bulk Flower or entry Pre-Roll. With average price at $26.74 versus category anchors at $29.58 in Flower and $43.15 in Concentrates, CMS Gardens has room to trade consumers up within non-Flower formats while using Flower’s 54.19% base and rank 95 as a traffic engine, implying a strategy that prioritizes mix-led margin lift over volume-led share defense.
Competitive Landscape
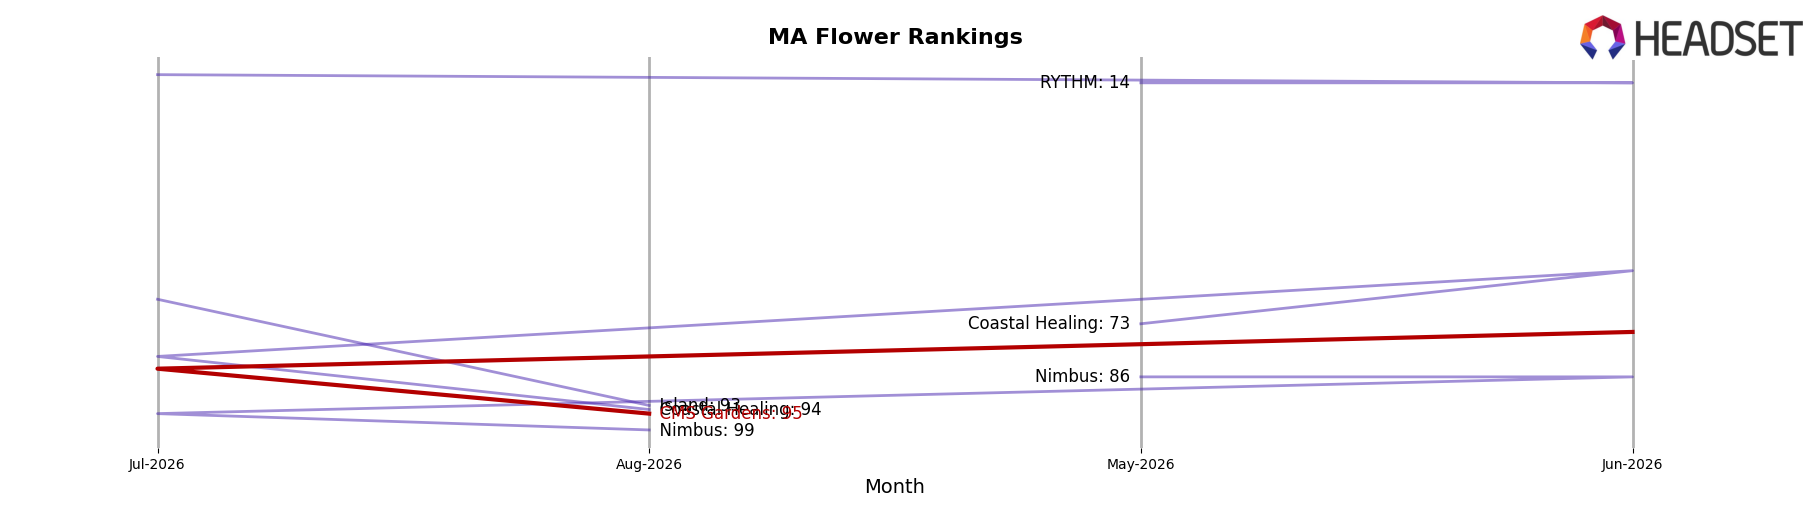
CMS Gardens sits at rank #95 in MA Flower in August 2026, improving 49 positions from #144 in May 2026 and sitting 61 spots below its peak at #34 in February 2026; the three-month climb indicates regained shelf presence while the longer slide from peak signals lingering volatility. Among leaders, Perpetual Harvest holds #1 and moved up 3 positions year over year with 51.8% sales growth, while Simply Herb is at #3 and fell 2 positions year over year with a 6.2% sales decline, placing CMS Gardens closer to mid-tier momentum than to top-tier stability. The pattern implies CMS Gardens’ recent rank recovery is tactical and fragile: a rebound of 34.0% in rank percentile versus May 2026 but a 179.4% distance from its February 2026 peak rank suggests progress depends on sustaining gains while leaders consolidate share.
Notable Products
Blueberry Breath Pre-Roll (1g) posted the standout move with a 94.5% month-over-month gain and climbed to rank 2, while the flagship Artificial Red Pre-Roll (1g) rose 11.0% to hold rank 1. In contrast, Peach Ringz (3.5g) fell 69.7% and slid to rank 6, and Blueberry Breath (3.5g) dropped 51.2% to rank 3, signaling a divergence where pre-rolls gain share as several 3.5g flowers retrench. Four of the top ten are Flower SKUs, yet three 3.5g entries carry double-digit declines between 25.3% and 69.7%, whereas pre-rolls occupy ranks 1–2 with positive momentum, indicating a shift in consumer preference toward ready-to-use formats. This pattern implies CMS Gardens is pivoting toward pre-roll-led velocity and away from smaller flower sizes, with larger 14g Flower formats stabilizing the basket via one mid-tier price point around $12.6k.
Top Selling Cannabis Brands






Data for this report comes from real-time sales reporting by participating cannabis retailers via their point-of-sale systems, which are linked up with Headset’s business intelligence software. Headset’s data is very reliable, as it comes digitally direct from our partner retailers. However, the potential does exist for misreporting in the instance of duplicates, incorrectly classified products, inaccurate entry of products into point-of-sale systems, or even simple human error at the point of purchase. Thus, there is a slight margin of error to consider. Brands listed on this page are ranked in the top twenty within the market and product category by total retail sales volume.

