.svg)

Jul-2026
Sales
Trend
6-Month
Product Count
SKUs
Avg Price
YoY Sales Change
YoY Price Change


Market Insights Snapshot
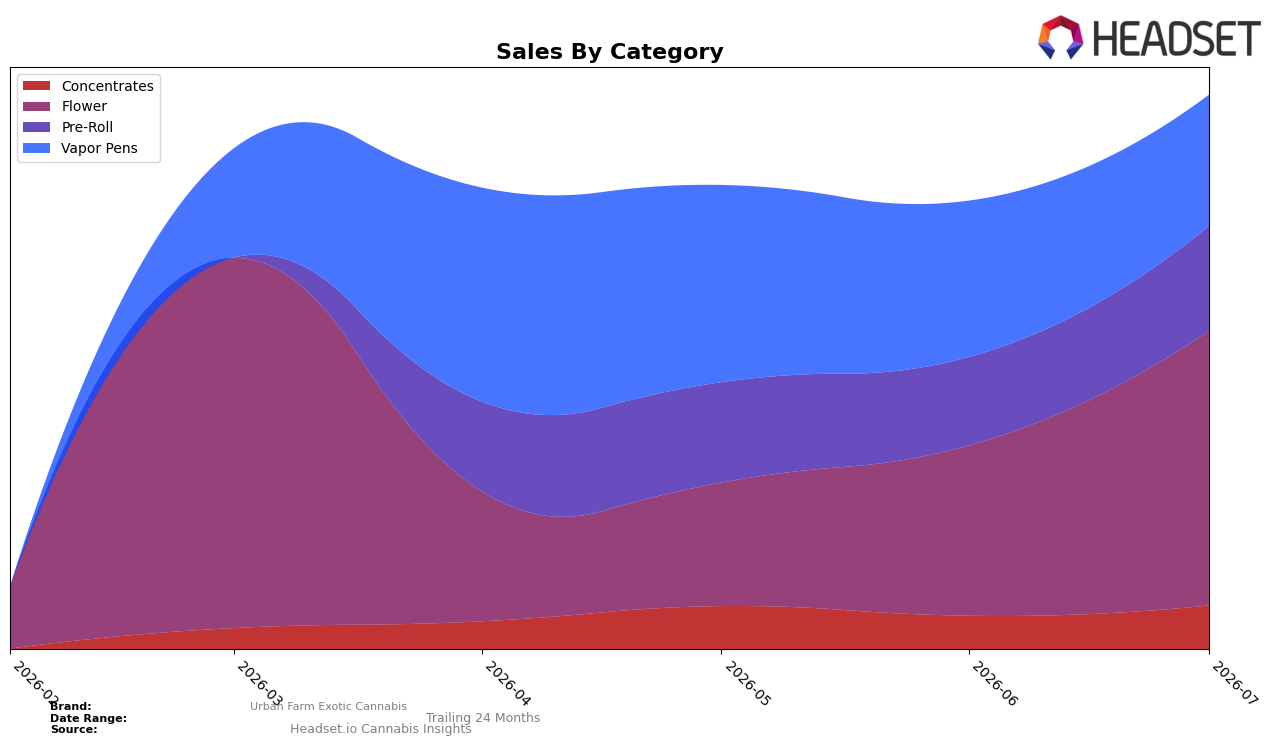
Urban Farm Exotic Cannabis concentrated nearly half of July 2026 sales in Flower at 49.60% share, with month-over-month growth of 61.26% paired with an average price of $31.73, while Vapor Pens fell to 23.68% share on a -16.04% MoM decline. Pre-Roll expanded to 18.91% share with an 18.72% MoM lift, and Concentrates reached 7.81% share on a 31.43% MoM increase; against this mix, the brand held a rank of 56 in Flower within Missouri. The pattern implies a pivot toward inhalable value and variety, with Flower and Pre-Roll gains offsetting a Vapor Pens contraction, positioning the brand to lean into categories where velocity is accelerating while monitoring margin impact from lower-priced formats.
With Flower’s 49.60% share and 61.26% MoM surge coinciding with Pre-Roll’s 18.72% MoM rise, the center of gravity is shifting toward faster-turn, combustion-led baskets, while Vapor Pens’ -16.04% MoM signals a soft spot that may cap premium upsell. Holding rank 56 in Flower in Missouri alongside a 31.43% MoM lift in Concentrates at 7.81% share suggests mid-pack visibility where incremental assortment depth and price-pack architecture can convert momentum in value-forward segments into sustainable share, rather than relying on a retreating Vapor Pens mix.
Competitive Landscape
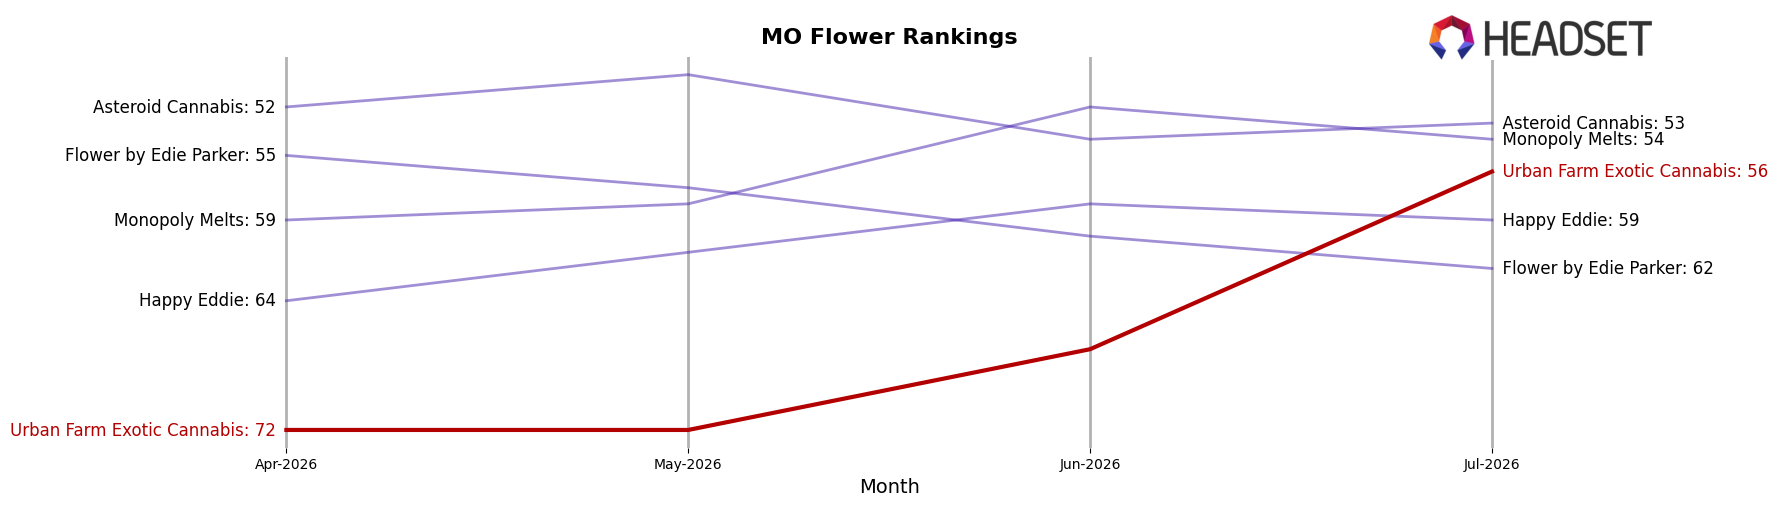
Urban Farm Exotic Cannabis sits at rank #56 in MO Flower for July 2026, improving 16 positions versus April 2026 when it was #72, while its peak rank of #54 in March 2026 places the current standing 2 spots below that high; meanwhile, Flora Farms remains at #1 with a -1.3% year-over-year sales change as Sinse Cannabis holds #2 with +9.0% YoY growth, indicating Urban Farm Exotic Cannabis is clawing back share month-over-month but not breaking into the tier where top-5 incumbents are either defending positions or expanding, which implies a trajectory of gradual recovery that still lacks the acceleration needed to sustain entry into the top 50.
Notable Products
Nuclear Slurpee (3.5g) delivered the standout move in July 2026 with a 375% month-over-month surge and a jump to rank 1, while Truffaloha (3.5g) fell 44% to rank 10, creating a stark split inside the Flower lineup. Pre-Rolls accounted for four of the top ten SKUs, yet the leading Pre-Roll, Nuclear Slurpee Infused Pre-Roll 2-Pack (1g), rose a more modest 38% at rank 2 versus the flat 0.03% growth for the rank-3 Ocean Fruit Live Hash Rosin Disposable (0.5g), indicating demand clustered around a single Flower hero rather than spreading evenly across form factors. The 28% decline for Supa Durba (3.5g) at rank 6 alongside the 13% uptick for Emergen-C Pre-Roll (1g) at rank 4 shows mix volatility between inhalable formats while one SKU captures disproportionate share, suggesting Urban Farm Exotic Cannabis is pivoting toward hero-SKU-driven Flower that can carry the portfolio even as secondary Flower items contract.
Top Selling Cannabis Brands






Data for this report comes from real-time sales reporting by participating cannabis retailers via their point-of-sale systems, which are linked up with Headset’s business intelligence software. Headset’s data is very reliable, as it comes digitally direct from our partner retailers. However, the potential does exist for misreporting in the instance of duplicates, incorrectly classified products, inaccurate entry of products into point-of-sale systems, or even simple human error at the point of purchase. Thus, there is a slight margin of error to consider. Brands listed on this page are ranked in the top twenty within the market and product category by total retail sales volume.

