.svg)

Still the Next Big Thing? A Cannabis Beverage Deep Dive

Introduction
Cannabis beverages have carried the "next big thing" label for the better part of a decade. Every year, a new wave of canned sodas, seltzers, and shots arrives promising to convert the casual, canna-curious consumer. And every year, the category stays small: barely more than a penny of every cannabis dollar in the US, and about two cents in Canada.
But small is not the same as static. In Q2 2026, US Beverage sales grew 9.3% year over year, well ahead of the broader market's 2% growth, and the category posted its highest share of US cannabis sales in the 15 months we examined. Underneath the headline numbers, the category is quietly repositioning itself: fast-growing Eastern markets are building the category around low-dose formats, carbonated formats are consolidating their lead, and the category's demographic profile, older and more female than cannabis overall, looks less like the rest of the dispensary and more like the mainstream beverage aisle.
This report examines the data behind the Beverage category across the US and Canada in Q2 2026, covering category share trends, market-by-market performance, segment and dosage shifts, brand dynamics, basket behavior, pricing, and the consumer demographics that will shape where the category goes next.
Methodology
Data for this report comes from real-time sales reporting by participating cannabis retailers via their point-of-sale systems, which are linked to Headset's business intelligence software. Headset's data is very reliable, as it comes digitally direct from our partner retailers. However, the potential does exist for misreporting in the instance of duplicates, incorrectly classified products, inaccurate entry of products into point-of-sale systems, or even simple human error at the point of purchase. Thus, there is a slight margin of error to consider.
Unless otherwise noted, sales data is from ON, AB, SK, BC markets in Canada and WA, OR, CA, AZ, CO, MI, FL, MA, NV, MD, IL, NY, OH, NJ, CT markets in the US. The following analysis reports on sales occurring in Q2 of 2026 unless otherwise indicated.
Key Takeaways
- Beverage reached 1.2% of US cannabis sales in Q2 2026 ($76.7M), its highest share ever. Dollar sales grew 9.3% YoY, more than four times the growth rate of the total US market.
- Canada's Beverage category is bigger but stalled. At 2.1% of sales ($22.6M CAD), Canadian Beverage share slipped 4% YoY in relative terms, and every tracked province posted a modest YoY share decline.
- Washington and California anchor the category in the US. Washington leads all markets at 2.9% share while California is the largest dollar market at $24.3M and gained 16% in relative share YoY.
- The East Coast is catching up fast. New Jersey (+69%), Connecticut (+67%), Michigan (+33%), and Maryland (+29%) posted the largest relative share gains among US states, echoing the adoption curve mature Western markets traced years ago.
- Carbonated is now the top US segment. At 29.2% of Beverage sales it overtook Iced Tea, Lemonade & Fruit (27.7%) YoY. In Canada, Carbonated still dominates at 61.4% but is losing ground to Water and tea-based formats.
- Low-dose is growing, but the growth is regional. Products at 10mg THC or less grew from 15.4% to 18.2% of US Beverage sales YoY, driven almost entirely by New York and the Northeast; low-dose share declined in every Western market. Canada, capped at 10mg per package, is seeing growth in multi-unit formats instead.
- Beverage is an add-on engine. One in three US Beverage baskets also contains an Edible, and roughly one in four contains a Pre-Roll, making Beverage one of the most attachment-friendly categories in the store.
- The demographic edge is real. Women account for 40.2% of US Beverage sales versus 34.7% of total cannabis, and Gen X over-indexes by 6 points. The caution flag: Gen Z under-indexes by nearly 8 points in both countries.
- Pricing is compressing in the US but holding in Canada. US average item price fell 6.8% YoY to $7.89; Canada has been remarkably stable at about $6.90 CAD for five straight quarters.
- Beverage is a summer category, and Canada feels it twice as hard. Canadian share swings roughly 14 points peak to trough across the year versus about 9 in the US. New Year's Eve is the biggest share day in both countries, and 4/20 is the biggest dollar day in the US.
- Shots are a US phenomenon. Nearly a third of US Beverage dollars come from shot formats (4oz or less), led by New Jersey (80%) and Washington (70%). In Canada, where packages are capped at 10mg, shots are under 2% of the category.
Sales Performance
Assortment
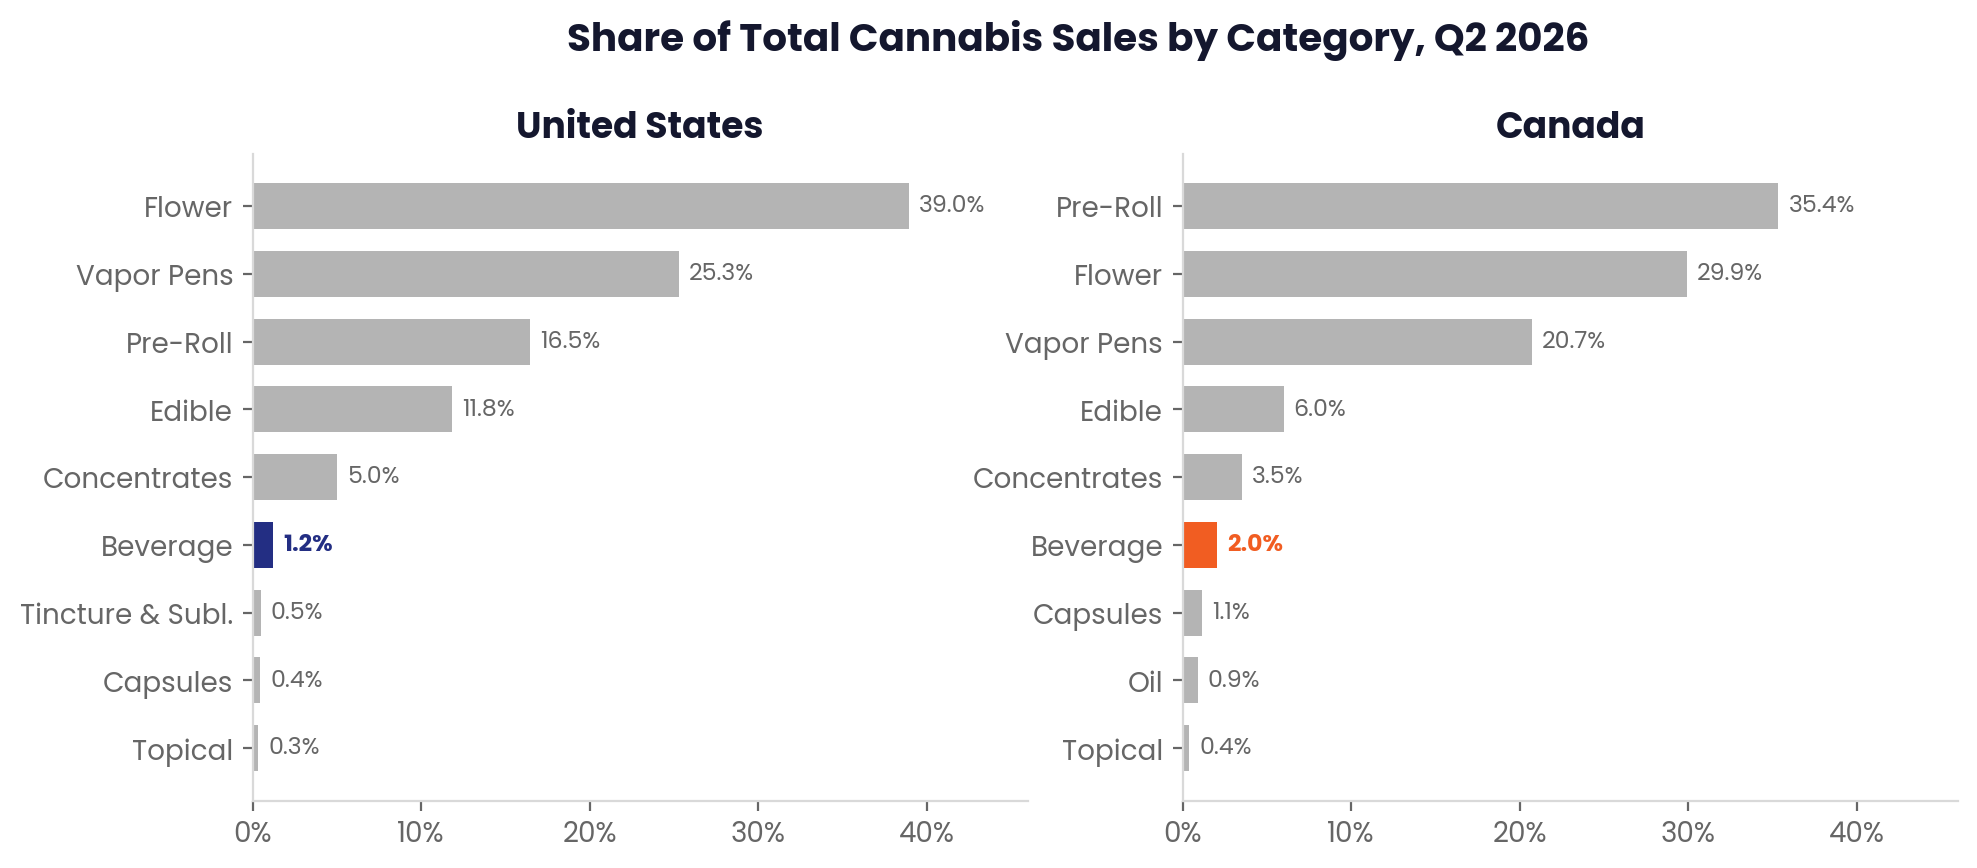
Beverage remains one of the smallest major categories in both countries, and that context matters for everything that follows. In the US, Beverage's 1.2% share puts it a full 3.8 points behind Concentrates and far from the inhalable categories that dominate the shelf. In Canada, the category is proportionally larger at 2.1%, roughly two-thirds the size of Concentrates.
The momentum, though, points in opposite directions. US Beverage share is up 7% YoY in relative terms and dollar sales grew 9.3%, against total market growth of just 2%. Beverage is small, but it is one of the few categories consistently outgrowing the market. Canada tells the reverse story: dollar sales dipped 1.2% YoY while the total Canadian market grew 3%, and share slipped accordingly. The market that proved beverages could reach 2% of sales is now the market where the category has plateaued.
Market Analysis
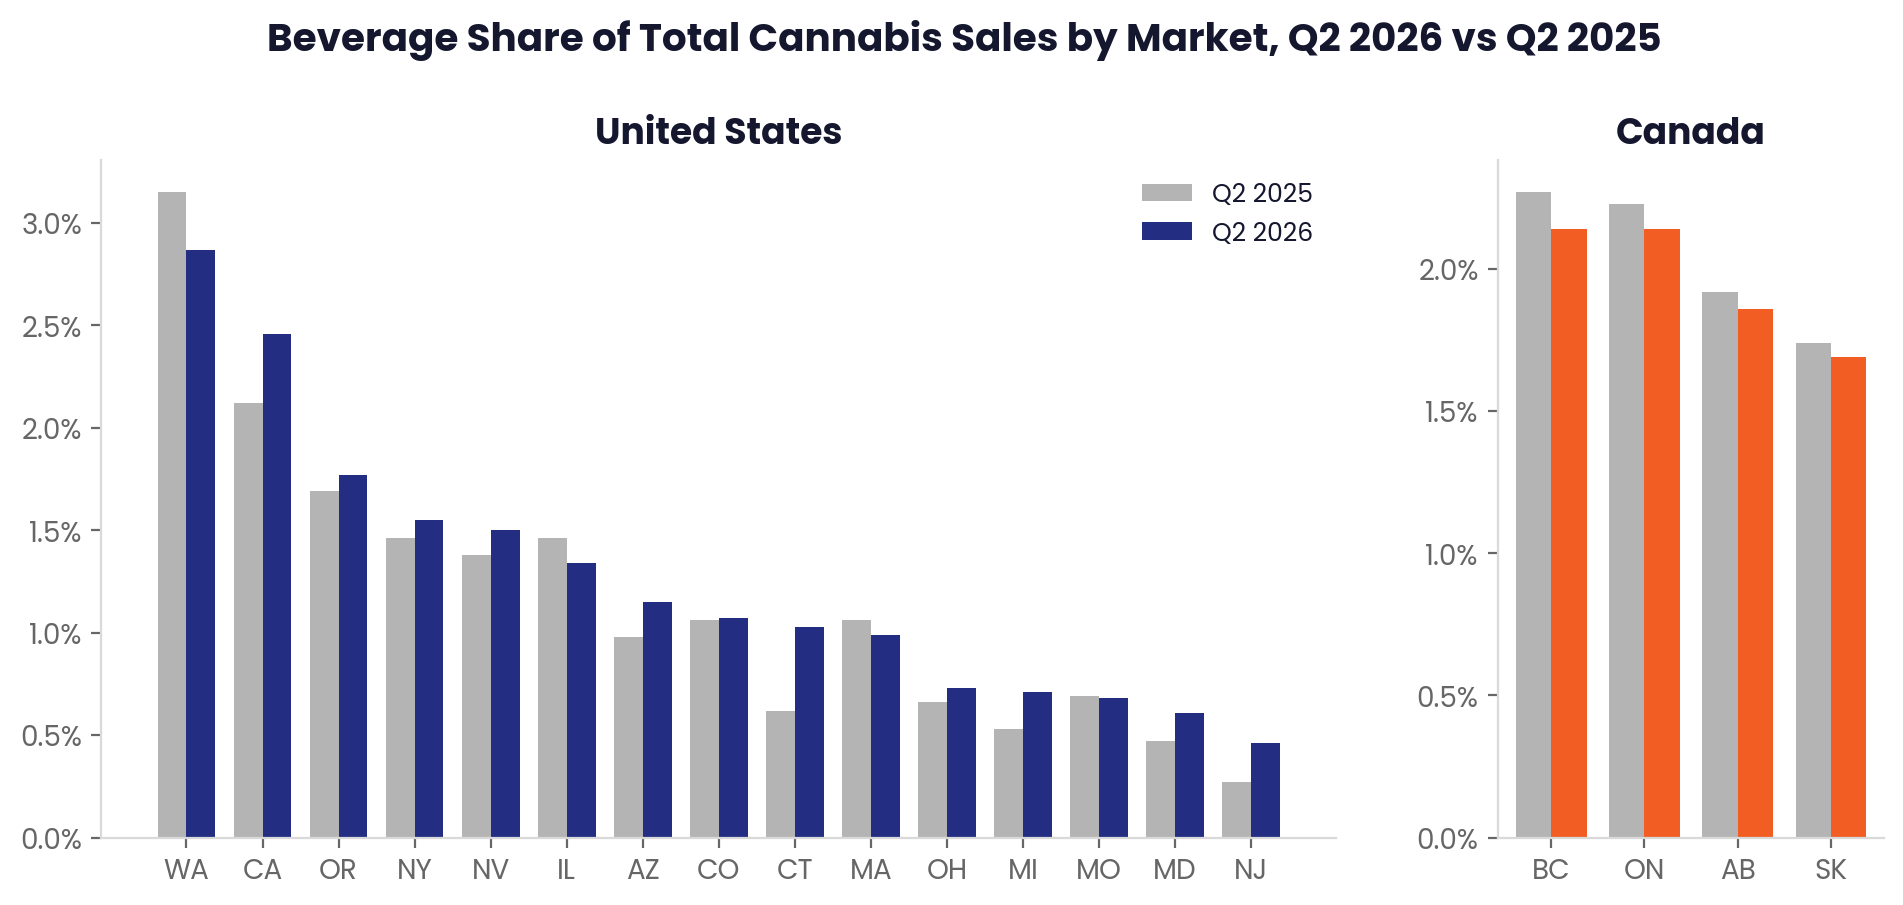
Washington's 2.9% beverage market share leads every market we track, a reminder that the oldest adult-use states have had the longest runway to build beverage habits. But the more interesting signal is who is climbing. California, the category's largest dollar market at $24.3M for the quarter, pushed from 2.1% to 2.5% YoY, a 16% relative gain that is remarkable for a market that mature. Meanwhile the newer East Coast markets are compressing the adoption curve: New Jersey's share grew 69% in relative terms, Connecticut 67%, and Maryland 29%, all from low bases. Michigan, long a beverage laggard at roughly half the national average, gained 33%.
The two markets moving backward are instructive. Washington slipped from 3.2% to 2.9% year over year, and Illinois fell from 1.5% to 1.3%. For brands, the picture is a familiar one: the ceiling is visible in the West, and the growth is in the East.
Canada's four tracked provinces cluster tightly between 1.7% and 2.1%, and all four declined modestly YoY. British Columbia and Ontario share the lead at 2.1%. The uniformity of the decline suggests a category-level dynamic rather than a provincial one: Canadian beverage consumers exist in numbers US markets have not yet reached, but the category has stopped recruiting new spend.
Category Performance Over Time
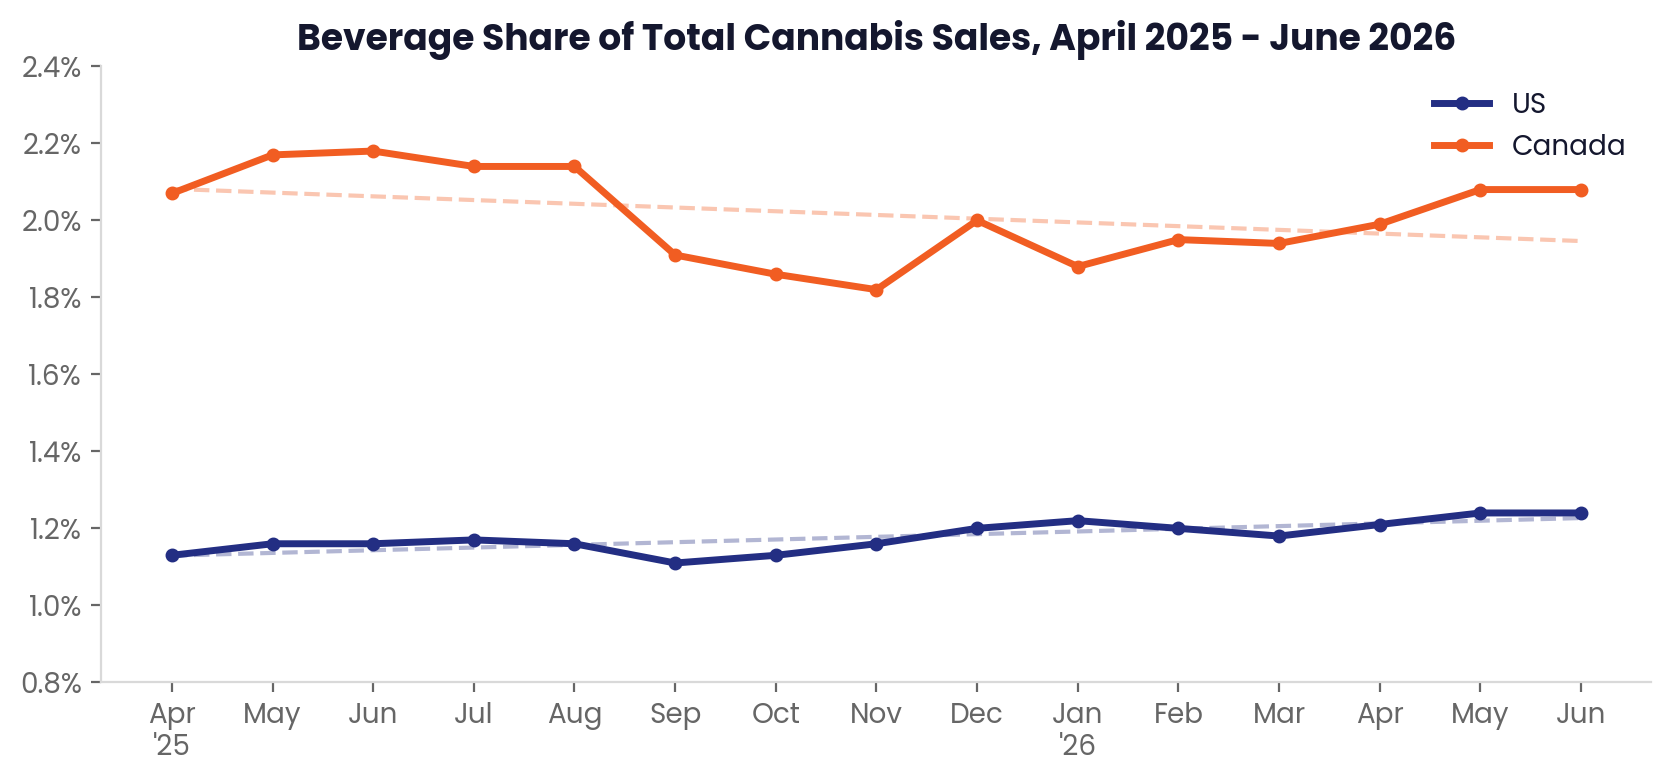
Fifteen months of monthly data sharpen the contrast. The US line is a slow, steady climb: 1.1% in April 2025 to 1.2% in June 2026, with barely a wobble along the way. No breakout, no collapse, just consistent incremental gains in a market where most small categories are shrinking.
Canada's line tells a story of seasonality and recovery. Share peaked at 2.2% in June 2025, slid through the fall to a November trough of 1.8%, then rebuilt to 2.1% by June 2026. Canadian beverage demand has a pronounced summer rhythm, and the category ends the period slightly below where it started. Watch the Q3 2026 numbers: if the summer peak fails to clear 2.2%, it would confirm a second consecutive year without category growth in Canada.
Seasonality
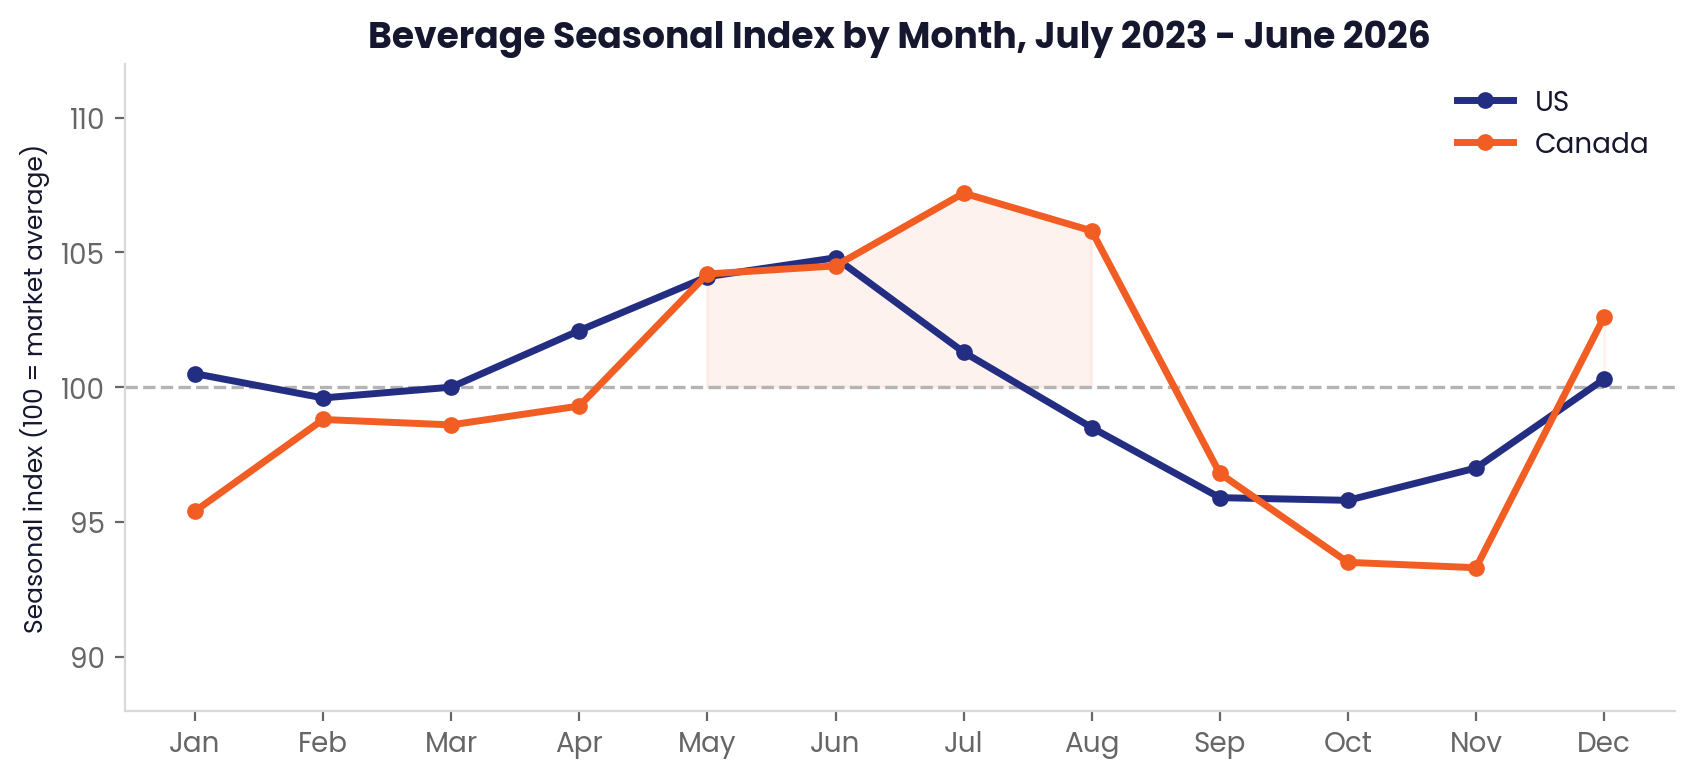
Beverage is the most seasonal category in cannabis. Across three years of data, Canadian share swings roughly 14 points from peak to trough: July indexes at 107 against its annual average while October and November sit near 93. The US follows the same summer-peaking curve at about two-thirds the amplitude. Read beverage trendlines with that in mind: Canada's autumn 2025 share slide was seasonal, not structural.
The calendar peaks look like the liquor aisle, not the dispensary. New Year's Eve is the biggest share day of the year in both countries (1.5% of US sales, 2.8% in Canada). 4/20 is the mirror image: the US category's biggest dollar day at $1.8M, but only a modest share bump because inhalables own the holiday. Week to week, Beverage is a weekend purchase, with Canadian share running 25 to 30% higher on Fridays and Saturdays than midweek. One US quirk worth watching: January has indexed above average two years running, consistent with Dry January substitution.
The takeaways for retailers: build cold-case space and inventory depth from Memorial Day through Labor Day, stage a second push for the December holidays, anchor promotions on Thursday through Saturday, and treat 4/20 as a volume day rather than a share day. For Canadian operators, the September-to-November trough is the time to manage inventory down, not to panic about the category.
Brand & Product Performance
Top Brands
| Market | Brand | Q2 Sales | # SKUs |
|---|---|---|---|
| AZ | Keef Cola | $1.27M | 32 |
| AZ | Sip Elixirs | $1.03M | 11 |
| AZ | Uncle Arnie's | $374.5K | 19 |
| CA | St Ides | $9.93M | 31 |
| CA | Uncle Arnie's | $4.67M | 47 |
| CA | Not Your Father's Root Beer | $2.75M | 14 |
| CO | Keef Cola | $1.26M | 44 |
| CO | Journeyman | $792.2K | 13 |
| CO | Ripple | $478.8K | 14 |
| CT | Lucky Break | $261.9K | 5 |
| CT | Soundview | $147.5K | 5 |
| CT | Zero Proof | $120.0K | 3 |
| IL | Uncle Arnie's | $1.87M | 23 |
| IL | Journeyman | $907.3K | 36 |
| IL | Daze Off | $655.5K | 11 |
| MA | Levia | $965.9K | 19 |
| MA | Hi5 Seltzer | $890.2K | 35 |
| MA | Buzzy | $456.4K | 15 |
| MD | Keef Cola | $702.1K | 17 |
| MD | Sunnies by SunMed | $409.3K | 16 |
| MD | Vibations | $388.8K | 15 |
| MI | Mary Jones | $1.23M | 19 |
| MI | Keef Cola | $959.0K | 21 |
| MI | CQ (Cannabis Quencher) | $520.7K | 19 |
| MO | Keef Cola | $1.17M | 37 |
| MO | Canna Cantina | $385.1K | 14 |
| MO | Illicit | $233.6K | 8 |
| NJ | Journeyman | $736.1K | 33 |
| NJ | Major | $182.1K | 11 |
| NJ | Boho Euphorics | $79.2K | 10 |
| NV | Sip Elixirs | $921.8K | 11 |
| NV | Keef Cola | $493.2K | 23 |
| NV | Uncle Arnie's | $261.6K | 14 |
| NY | Ayrloom | $4.28M | 42 |
| NY | Layup | $1.10M | 25 |
| NY | Harney Brothers Cannabis | $546.3K | 49 |
| OH | Wellspring Fields | $868.9K | 38 |
| OH | Certified | $792.7K | 9 |
| OH | Butterfly Effect - Grow Ohio | $484.2K | 8 |
| OR | Magic Number | $1.64M | 61 |
| OR | Keef Cola | $632.5K | 32 |
| OR | Mary Jones | $537.3K | 15 |
| WA | Journeyman | $1.59M | 24 |
| WA | Ray's Lemonade | $1.51M | 22 |
| WA | Craft Elixirs | $1.13M | 38 |
| Market | Brand | Q2 Sales | # SKUs |
|---|---|---|---|
| AB | XMG | $1.65M | 28 |
| AB | Mary Jones | $770.6K | 14 |
| AB | Mollo | $436.1K | 15 |
| BC | Bubble Kush | $777.1K | 5 |
| BC | XMG | $660.5K | 15 |
| BC | Mollo | $641.7K | 10 |
| ON | Versus | $1.39M | 14 |
| ON | XMG | $1.37M | 33 |
| ON | Deep Space | $1.21M | 8 |
| SK | XMG | $319.4K | 26 |
| SK | Versus | $88.7K | 9 |
| SK | Little Victory | $61.2K | 12 |
Top Products
| Rank | Product | Brand | Q2 Sales |
|---|---|---|---|
| 1 | Strawberry Kiwi Shot (100mg THC, 2oz) | Uncle Arnie's | $2.31M |
| 2 | Wild Raspberry Iced High Tea (100mg THC, 12oz, 355ml) | St Ides | $2.05M |
| 3 | Georgia Peach High Tea (100mg THC, 12oz, 355ml) | St Ides | $1.42M |
| 4 | Sunrise Orange With Caffeine Shot (100mg THC, 2oz) | Uncle Arnie's | $1.28M |
| 5 | Magic Mango Rosin Shot (100mg THC, 2oz) | Uncle Arnie's | $1.19M |
| 6 | Maui Mango Infused High Tea (100mg THC, 12oz, 355ml) | St Ides | $1.11M |
| 7 | Lychee Pear High Tea (100mg THC, 12oz, 355ml) | St Ides | $1.05M |
| 8 | CBD/THC 1:2 Up Honeycrisp Apple Cider (5mg CBD, 10mg THC, 12oz) | Ayrloom | $982.4K |
| 9 | Pineapple Lemonade (100mg THC, 60ml, 2oz) | Journeyman | $894.6K |
| 10 | High Punch High Tea (100mg THC, 12oz) | St Ides | $812.3K |
| Rank | Product | Brand | Q2 Sales |
|---|---|---|---|
| 1 | Clementine Sparkling Beverage (10mg THC, 355ml) | XMG | $712.4K |
| 2 | Tropical Fruit Sparkling Beverage (10mg THC, 355ml) | XMG | $531.8K |
| 3 | Root Beer Soda (10mg THC, 355ml) | Mary Jones | $402.6K |
| 4 | Blue Raspberry Fizz (10mg THC, 355ml) | Versus | $381.9K |
| 5 | Grape Sparkling Beverage (10mg THC, 355ml) | XMG | $346.2K |
| 6 | Lime Sparkling Water (10mg THC, 355ml) | Mollo | $298.7K |
| 7 | Peach Iced Tea (10mg THC, 355ml) | Deep Space | $271.5K |
| 8 | Berry Blast Fizz (10mg THC, 355ml) | Versus | $246.8K |
| 9 | Zero Berry Lemonade Soda (10mg THC, 355ml) | Mary Jones | $228.4K |
| 10 | Cola Sparkling Beverage (10mg THC, 355ml) | Bubble Kush | $209.1K |
Metadata Traits
Segment
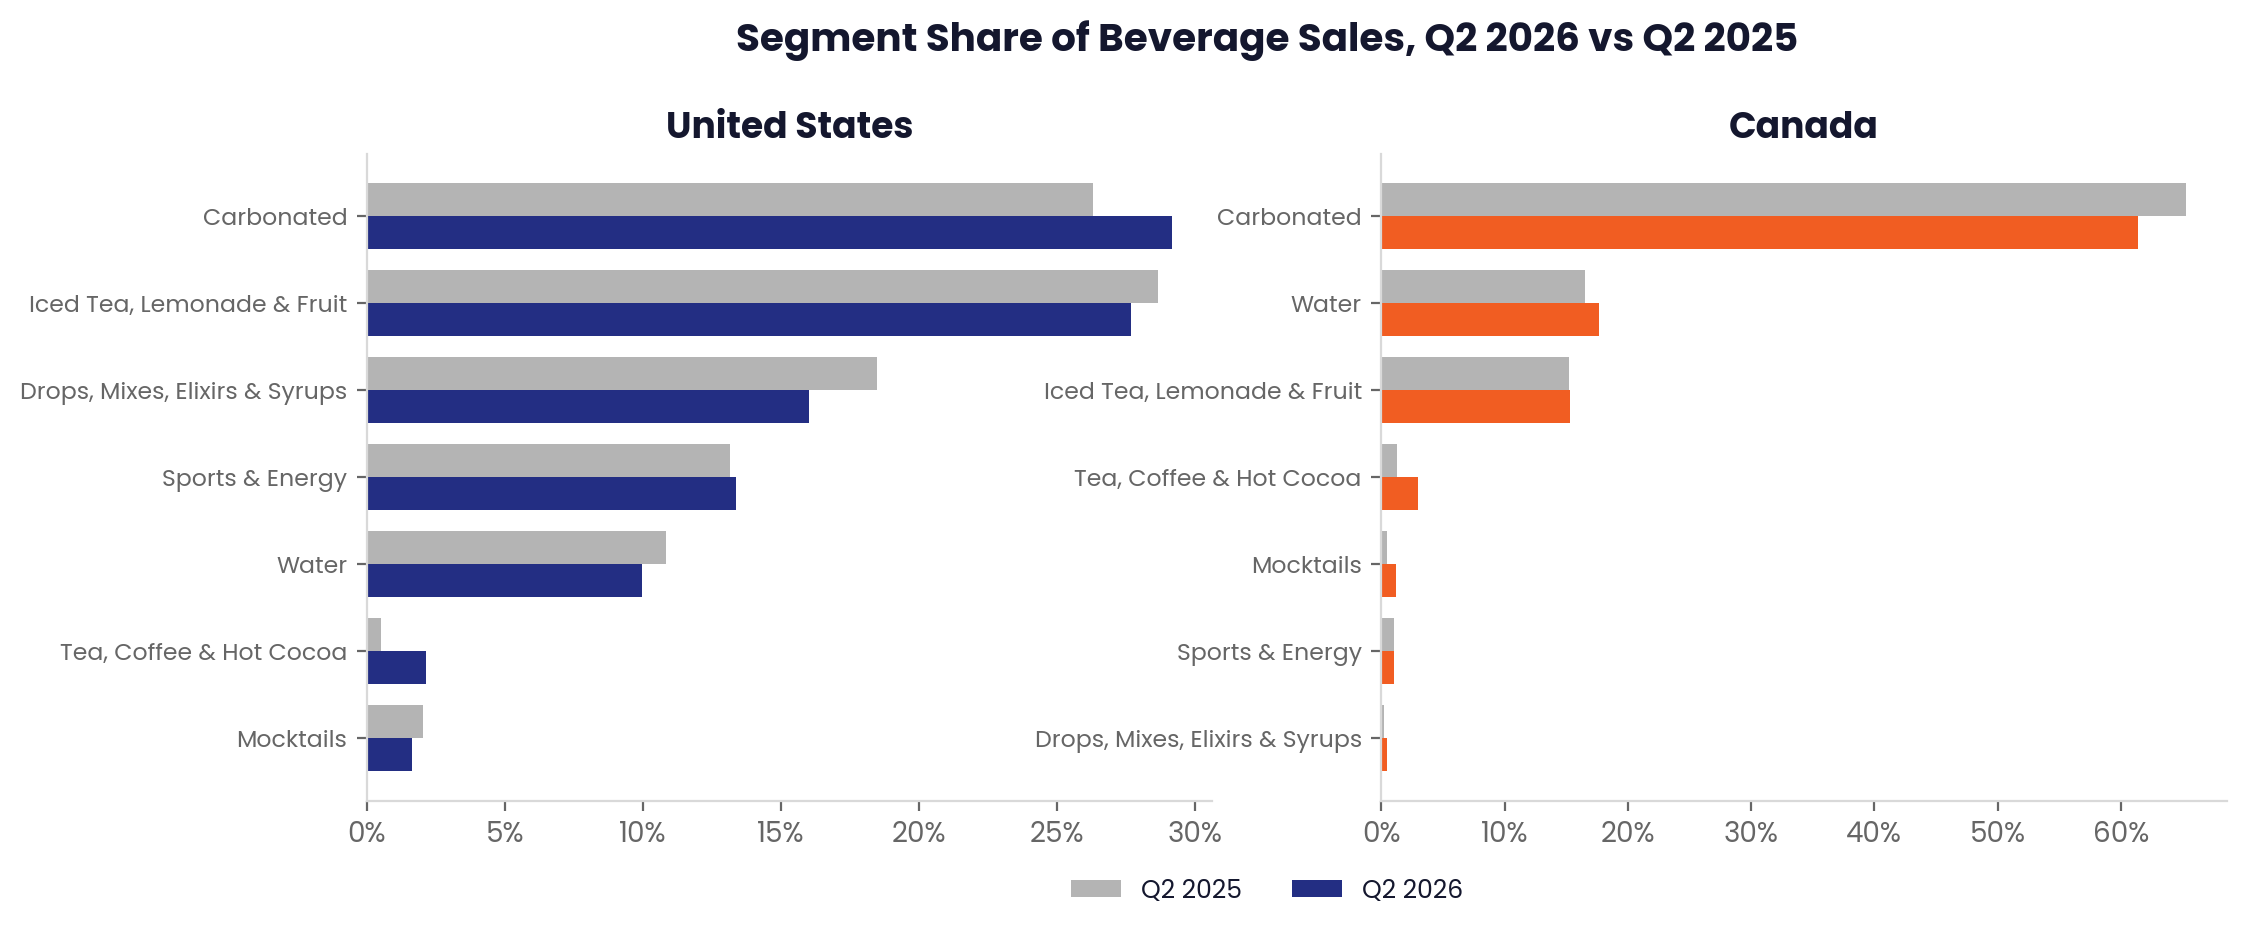
In the US, Carbonated has taken the top spot. At 29.2% of Beverage sales, up from 26.3% a year ago, sodas and seltzers edged past Iced Tea, Lemonade & Fruit (27.7%, down slightly). The bigger structural loser is Drops, Mixes, Elixirs & Syrups, which fell from 18.5% to 16%: consumers are choosing ready-to-drink over DIY. Two small segments are worth watching at the margins. Tea, Coffee & Hot Cocoa quadrupled its share YoY to 2.2%, and Sports & Energy continues its quiet climb at 13.4%.
Canada is a Carbonated market first and everything else second, but the gap is narrowing. Carbonated's share fell from 65.3% to 61.4% YoY while Water (17.6%) and Tea, Coffee & Hot Cocoa (3%, up from 1.2%) absorbed the difference. Iced Tea, Lemonade & Fruit held steady at 15.3%. Canadian consumers are diversifying within the category even as the category itself stands still.
THC Dose
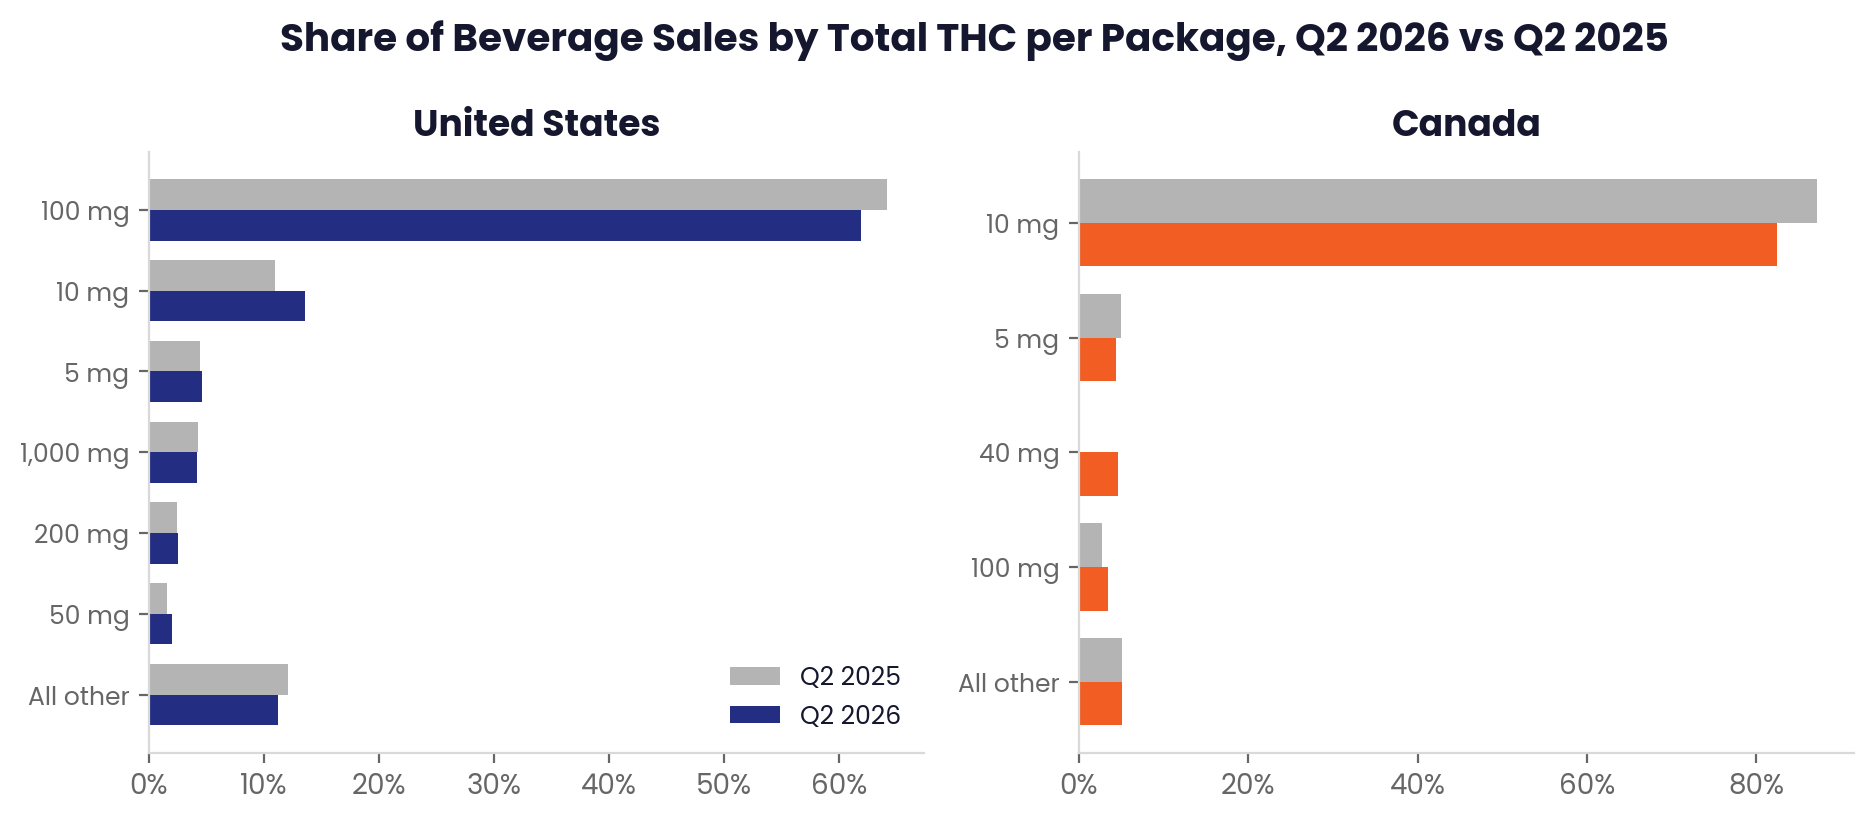
Dose is where US and Canadian beverages are least alike. The 100mg package remains the backbone of the US category at 61.9% of sales, but it gave up 2.3 points of share YoY. The beneficiary is the low-dose end: 10mg products jumped from 11% to 13.6% of sales (dollar sales up 35% YoY), and products at 10mg or less now account for 18.2% of the category, up from 15.4%. That national number, though, needs a regional asterisk.
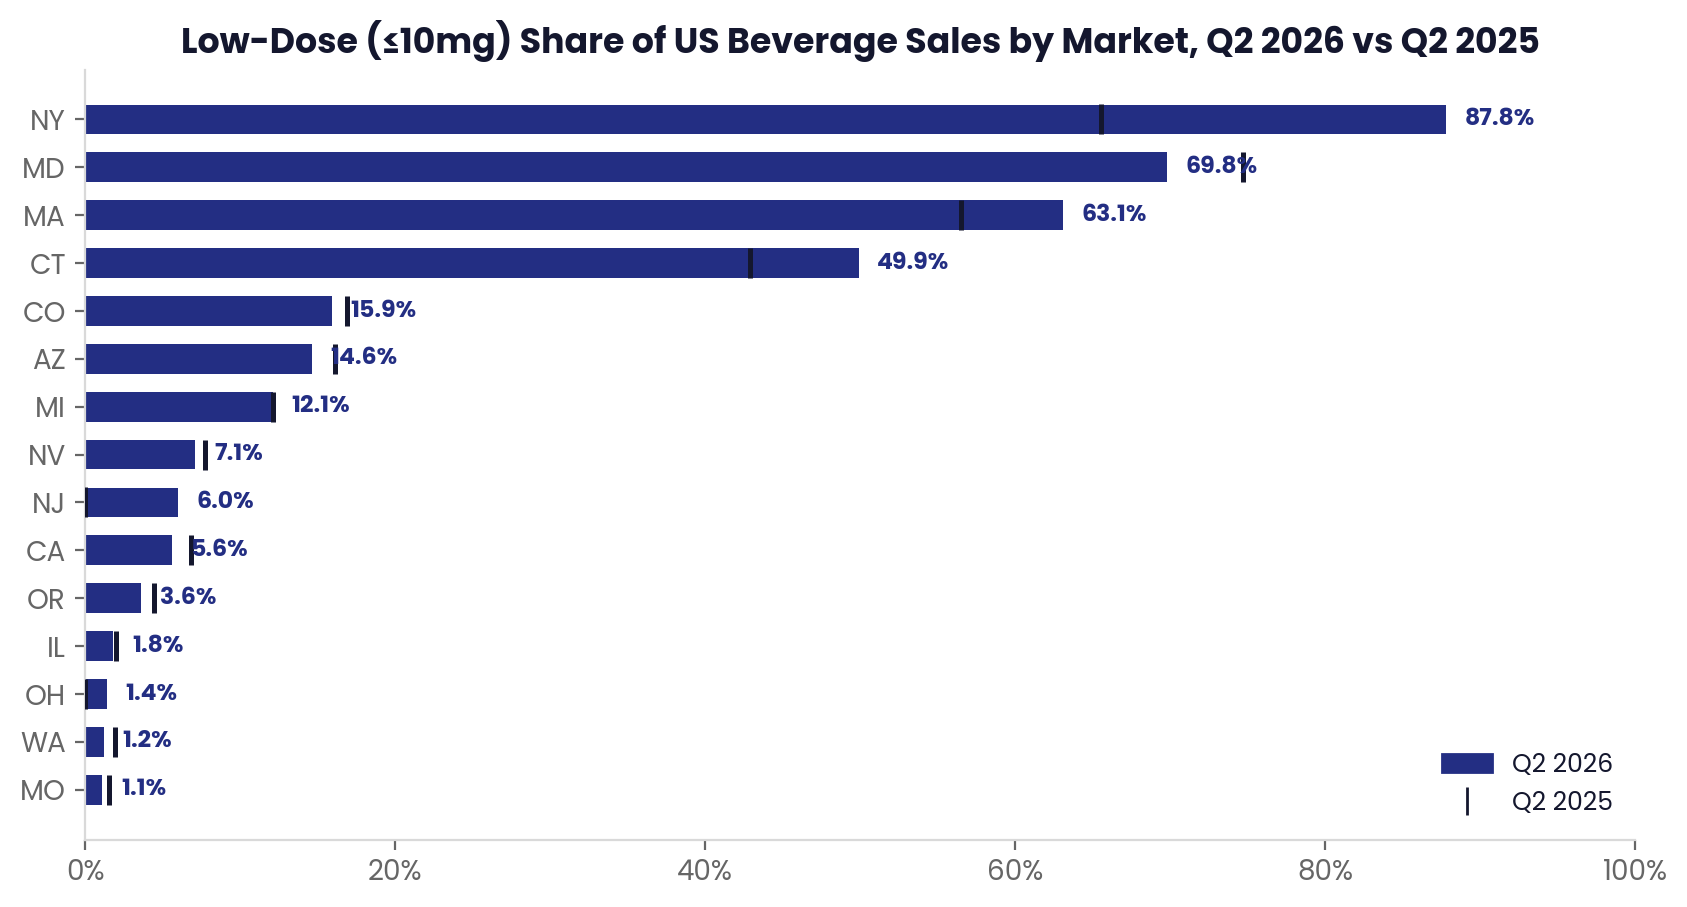
The low-dose growth is concentrated, not national. Low-dose formats dominate the young Northeastern markets: 87.8% of dispensary beverage sales in New York (up from 65.5% a year ago), 63.1% in Massachusetts, and 49.9% in Connecticut, all rising. New York alone accounts for roughly three-quarters of national low-dose dollar growth, and excluding it, national low-dose share is nearly flat YoY (11.5% to 11.7%). Within-state low-dose share declined in 9 of 15 tracked markets, including every Western state: 5.6% in California, 3.6% in Oregon, and 1.2% in Washington, each down from a year ago. The low-dose wave is real but geographic. New Eastern markets are adopting sessionable formats as the category default, while established dispensary shoppers show no sign of trading down from 100mg. If anything, mature markets are consolidating the other way: the 100mg format gained share of beverage sales YoY in California (74.8% to 76%), Oregon (49.8% to 55.9%), Colorado (81% to 82.7%), and Washington (96.3% to 96.6%), and 100mg shelf presence expanded in all four while low-dose listings contracted in three. In Oregon, low-dose shelf presence expanded sharply year over year while low-dose dollars edged down, more shelf space chasing flat-to-declining demand. Assortment in legacy markets has largely settled, and where it still moves, it moves toward potency.
Canada's dose mix is regulation in chart form: 82.5% of sales sit at exactly 10mg, the federal per-package cap. The interesting movement is the emergence of 40mg formats at 4.6% of sales, essentially from zero a year ago, reflecting multi-unit packs that work within the rules. That is the closest thing Canada has to a value-dose trend, and it is growing quickly.
Shots
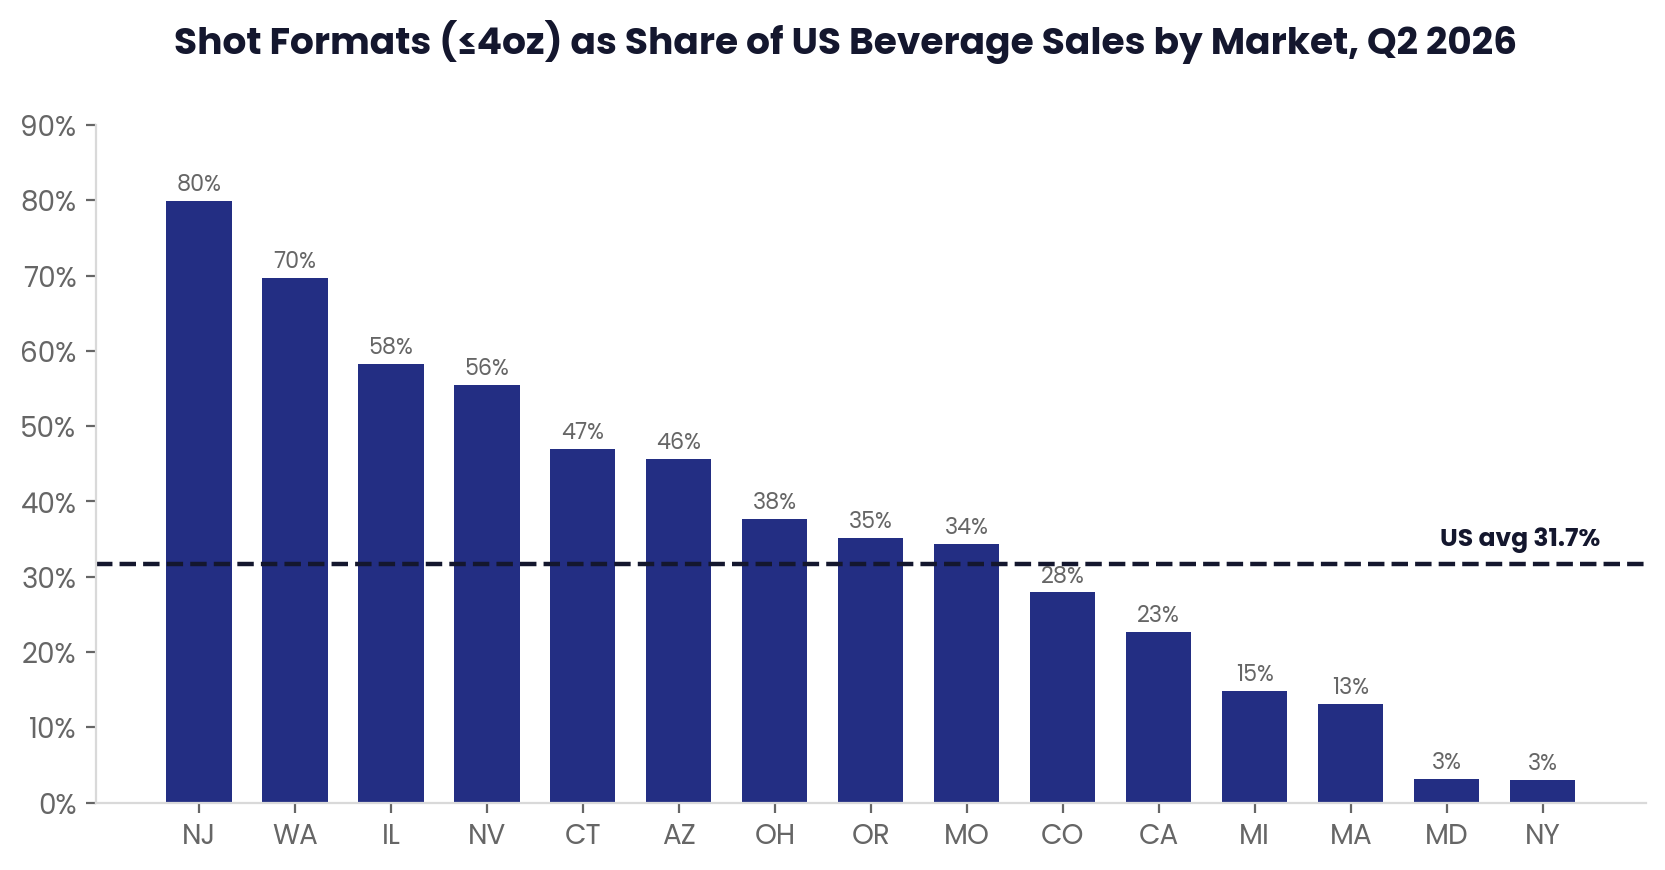
Shots, beverage formats of 4oz or less, are a defining US format and a rounding error in Canada. Nearly a third of US Beverage dollars ($24.3M in Q2 2026, 31.7% of the category) come from shots, a share that has held steady YoY. In Canada, shots are 1.7% of the category and shrinking, and Saskatchewan recorded no shot sales at all. The gap is structural: shots exist to pack potency into a small, cheap package, and Canada's 10mg-per-package cap removes their reason to exist.
Within the US, shot prevalence maps cleanly to the potency-first markets. New Jersey leads at 79.9% of beverage sales, followed by Washington (69.7%), Illinois (58.3%), and Nevada (55.5%). At the other end sit the low-dose strongholds: New York (3%), Maryland (3.1%), and Massachusetts (13.1%). Shots and sessionable cans are mirror images of each other, and a market's position on that spectrum is the single fastest read on what its beverage consumer wants. Pricing reflects the same split: the average shot rings up at $6.36 in Washington and $6.85 in Arizona, versus $31.55 in Massachusetts and $24.68 in Connecticut, where shots are scarce, higher-dose specialty items. For brands, the practical takeaway is that a beverage portfolio is really two portfolios, and the right lead format flips depending on which side of the map a market sits on.
Basket Behavior
Penetration & Attachment
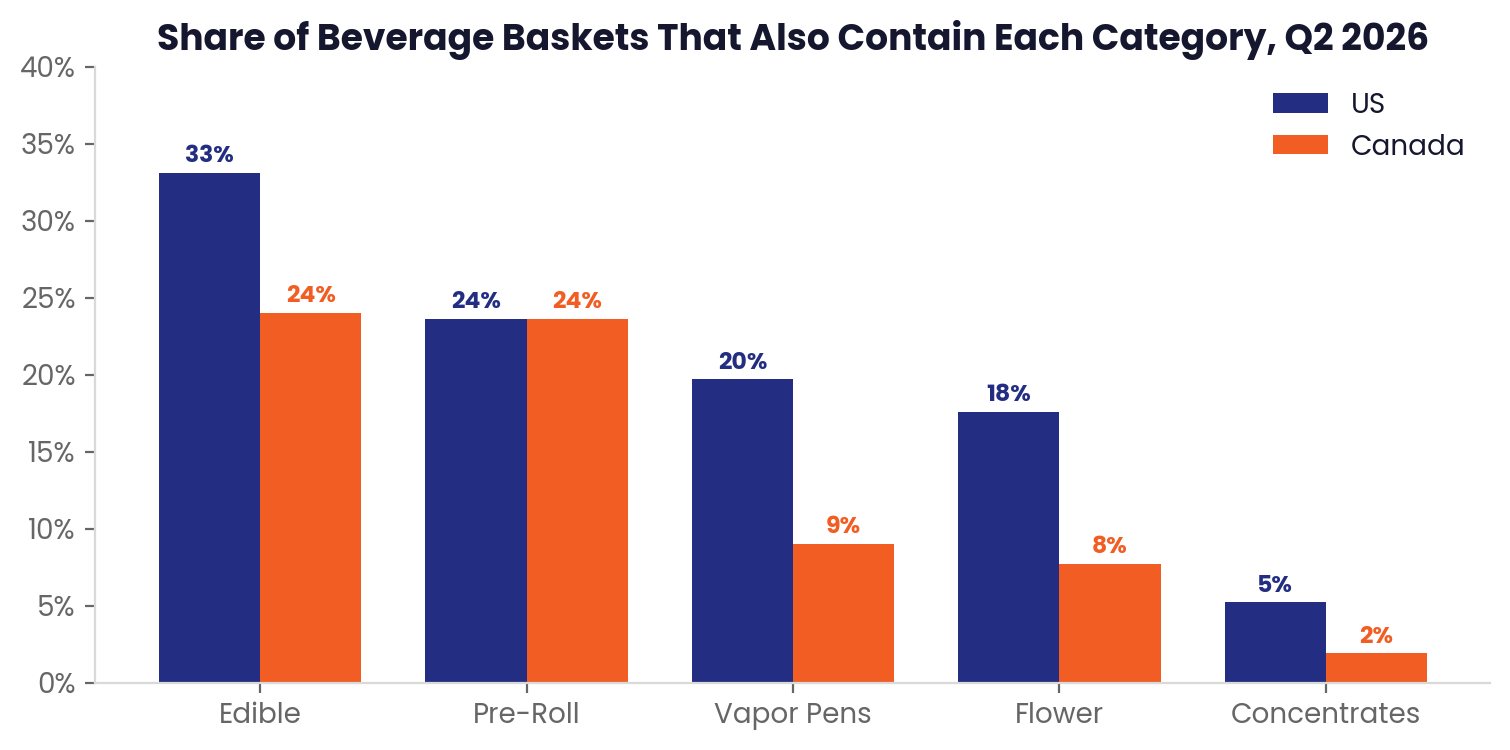
Beverage shows up in 3.5% of US baskets, up 5% in relative terms YoY, and 4.2% of Canadian baskets, down 5%. Basket penetration is tracking the same directions as dollar share in both countries.
What makes Beverage strategically interesting is what else is in those baskets. In the US, 33% of Beverage baskets also contain an Edible, 24% contain a Pre-Roll, and 20% contain a Vapor Pen. Beverage buyers are rarely buying only a drink; they are adding a drink to a trip anchored by something else. The reverse view confirms it: Beverage appears in 6.7% of US Edible baskets, its strongest attachment, versus just 1.6% of Flower baskets. Canada shows the same shape at lower intensity, with Edible (24%) and Pre-Roll (24%) the leading companions.
The retail implication is straightforward. Beverage behaves like a complement to the edibles buyer, not a substitute for the inhalables buyer. Cold cases positioned near edibles displays, and bundle promotions pairing drinks with gummies or pre-rolls, formalize a pairing consumers are already making on their own.
Pricing
Market Pricing
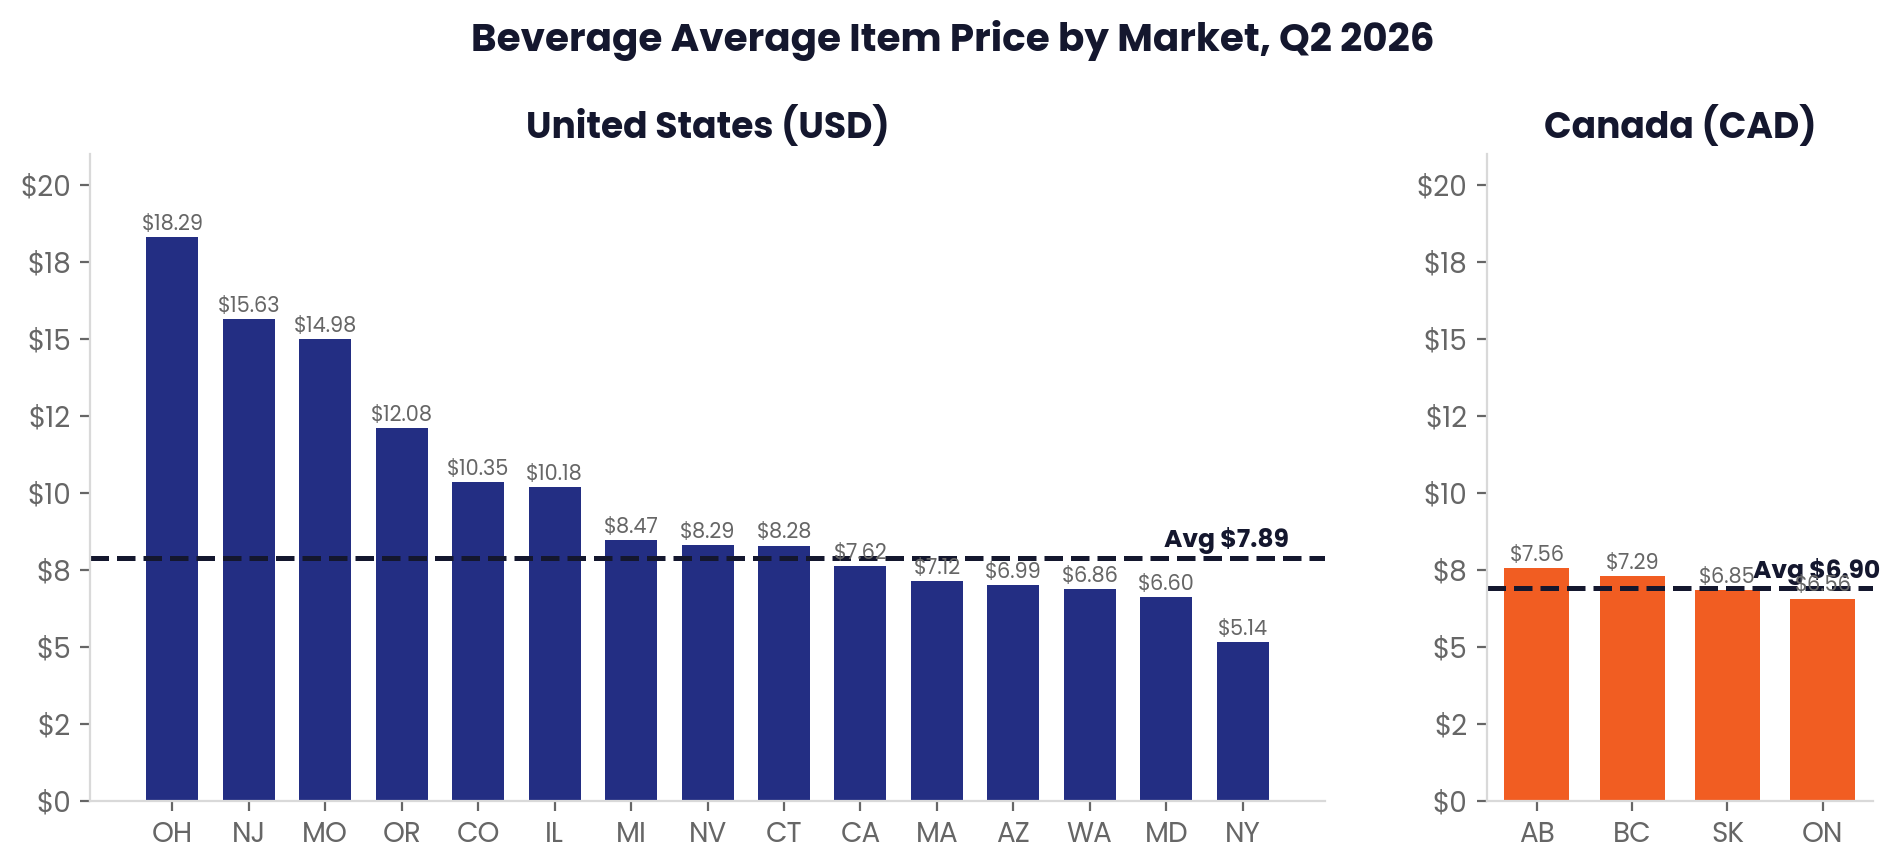
The US average item price of $7.89 conceals a nearly four-fold spread across states. Ohio ($18.29), New Jersey ($15.63), and Missouri ($14.98) sit at the premium end, typical of newer or supply-constrained markets. New York is the outlier at the bottom: $5.14 per item, the cheapest beverage market in the country, driven by value-priced 100mg formats like St Ides. The mature Western markets cluster in the $6.86 to $7.62 range, which is likely where newer markets will eventually settle.
Canada's provincial spread is barely a dollar, from Alberta at $7.56 to Ontario at $6.56, consistent with the tighter regulatory and competitive band Canadian retail operates in.
Pricing Over Time
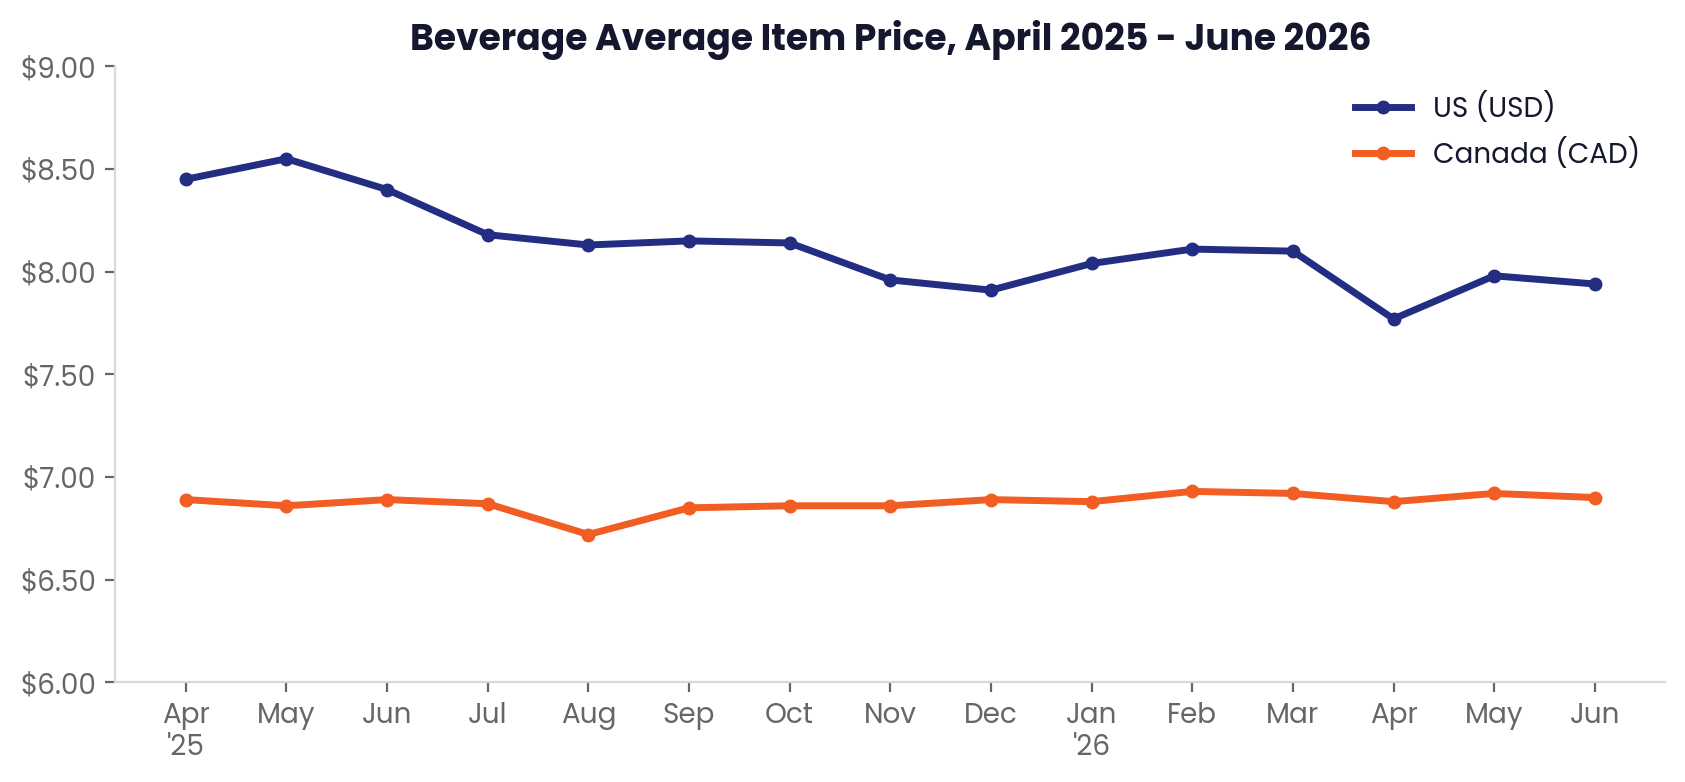
US beverage pricing is compressing at a measured pace: average item price fell from $8.45 in April 2025 to $7.94 in June 2026, a 6% decline that mirrors the deflation running through most US cannabis categories. Notably, the low-dose mix shift is part of this story; as more 10mg and 5mg products enter the mix, the average ticket naturally drifts down even where like-for-like prices hold.
Canada is the picture of stability. Average item price has stayed within a 21-cent band around $6.90 CAD for the entire 15-month window. In a category with flat sales, flat pricing means the margin story is not deteriorating, but nothing is pulling the category upmarket either.
Demographics
Age Group
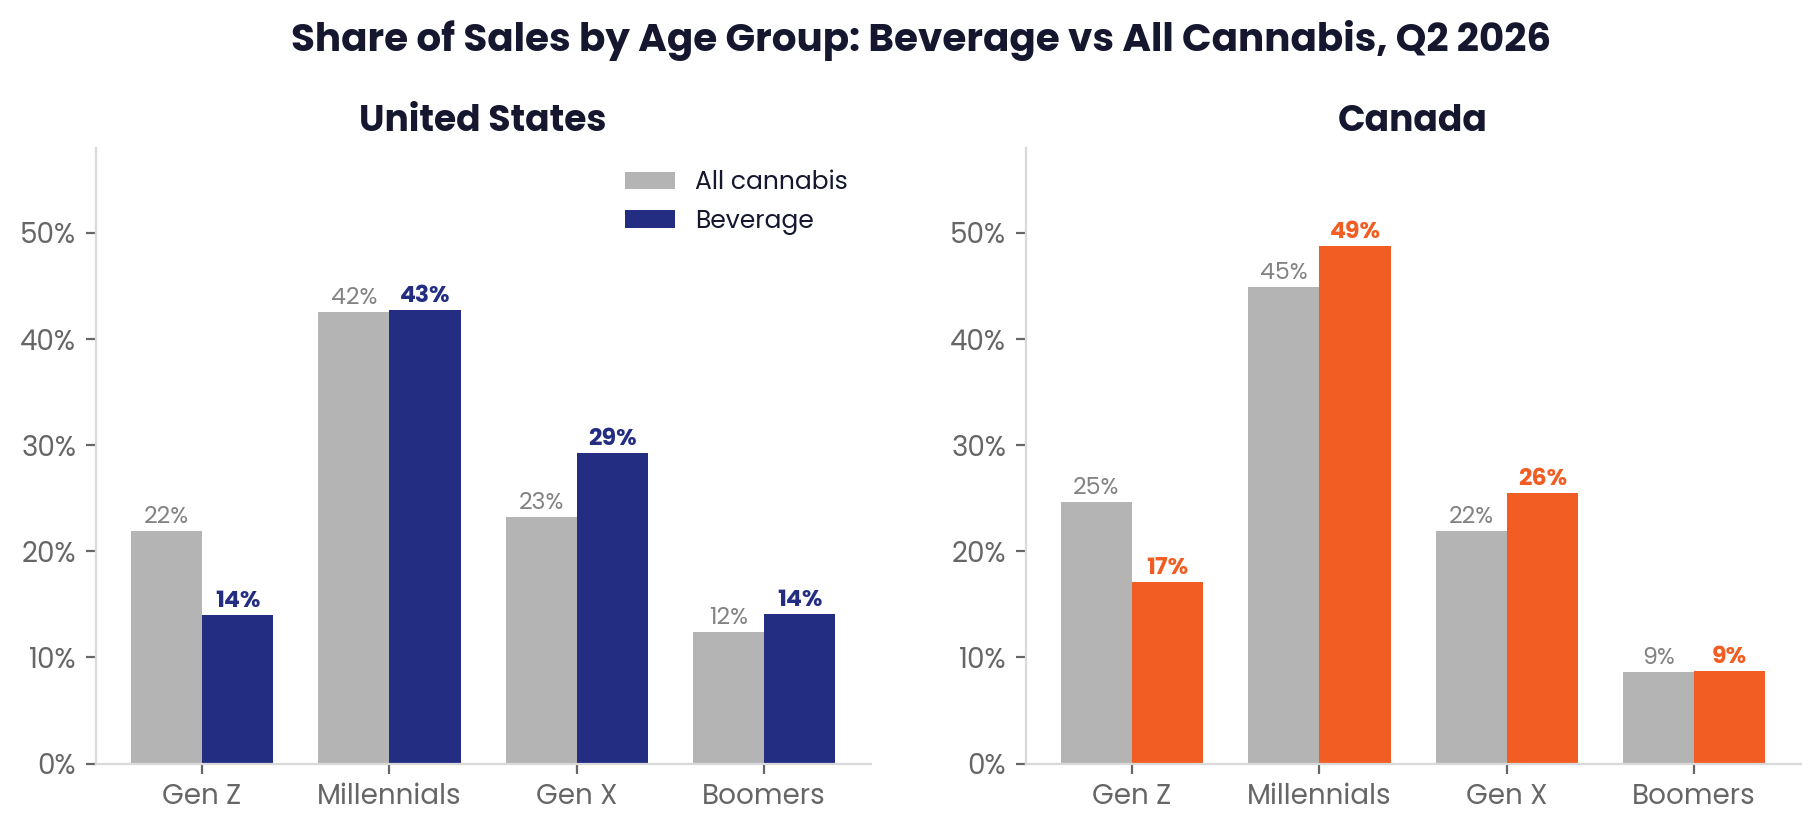
Beverage skews old, and it does so consistently in both countries. In the US, Gen X accounts for 29.2% of Beverage sales against 23.2% of total cannabis sales, a 6-point over-index that is among the largest for any major category. Boomers also over-index modestly. Millennials, at 42.7%, mirror their overall market weight. The gap is Gen Z: 14% of Beverage sales versus 21.9% of the total market, an under-index of nearly 8 points.
Canada repeats the pattern almost exactly: Gen X +3.6 points, Millennials +3.8, and Gen Z 7.5 points below its market baseline. A category built on approachability is, so far, resonating most with consumers who already have two decades of purchasing habits behind them. That is a fine place to build a business today and a real question for the category's second decade, particularly since Gen Z is the cohort most exposed to hemp-derived THC beverages in mainstream retail channels.
Gender
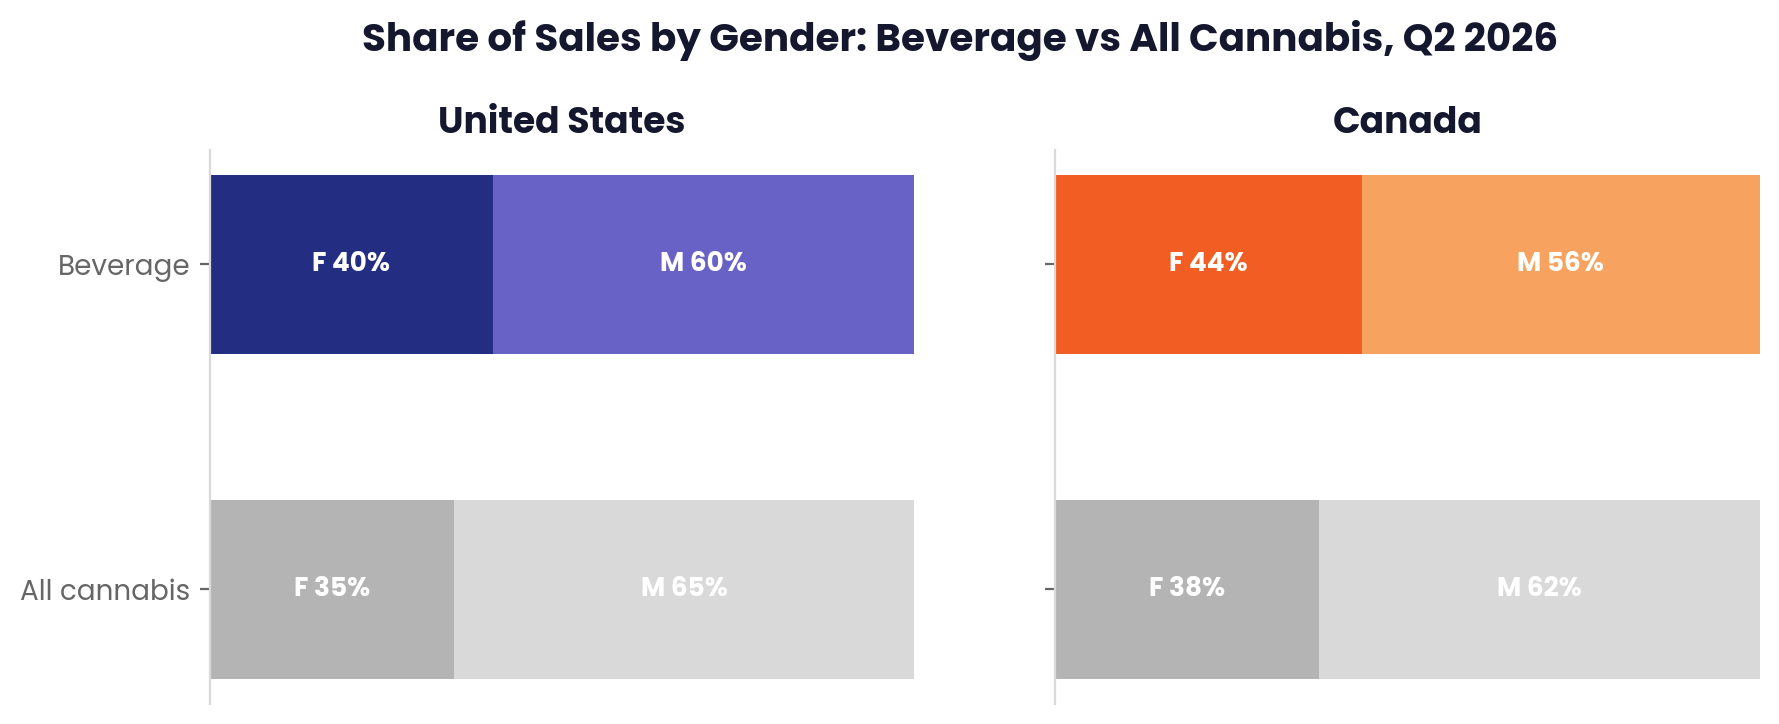
Beverage has one of the clearest gender signatures in cannabis. Women account for 40.2% of US Beverage sales versus 34.7% of the overall market, a 5.5-point over-index. Canada is stronger still: 43.5% versus a 37.5% baseline, a 6-point lift. Only a handful of categories over-index with women at this magnitude, and the consistency across two very different regulatory environments suggests it reflects the format itself: familiar, sessionable, and social. For brands building creative, packaging, and retail strategy, this is the category's most durable demographic asset.
Conclusion
After a decade of hype, cannabis beverages in Q2 2026 look less like a breakout than a category settling into its lane. It stays small, about 1.2% of US sales and 2.1% in Canada, but the US grew 9.3% year over year, more than four times the total market, while Canada has been flat for two years. In both countries the shape is consistent: seasonal and social, an add-on that attaches to edibles and pre-rolls rather than a destination, and a reliable draw for a shopper the rest of the dispensary misses, over-indexing with women and Gen X, under-indexing with Gen Z.
The defining lesson is that the category splits along a regulatory line. Where the US leaves dose unregulated, dollars flow to potency and value: a 100mg backbone, shots at nearly a third of sales, and a low-dose “wave” that is really concentrated in a few young Eastern markets. Where Canada caps packages at 10mg, the category has taken the mainstream sessionable form the industry keeps predicting, built on low-dose cans and a fast-rising multi-pack. What has worked is clear: beverages grow even in a deflationary market and pull a differentiated shopper into the store. What has not materialized is the original pitch, a mass-market low-dose drink winning broadly inside US dispensaries. That consumer exists, but the hemp-beverage boom shows the demand has largely been met outside the licensed channel, a balance a pending federal hemp change could shift.
The takeaways diverge by audience. Brands should run two portfolios, leading with potency where the shelf rewards it and sessionable low-dose formats where rules or a younger base do. Retailers should treat beverages as a basket-builder and reach play, not a volume driver: merchandise beside edibles, promote into summer and holiday occasions, and build the low-dose set before demand arrives. Investors should weigh growth rate and consumer differentiation over absolute share, and treat regulation as the biggest swing factor ahead. Beverages will not carry a dispensary on their own in 2026, but they reach customers and occasions nothing else in the store can, and that is a position worth owning.
Go deeper on the data


